CD34+ pluripotent progenitor stems cells can give rise to a type of leukocyte termed granulocyte, specifically of the basophil kind. The latter represents less than 1% of peripheral blood leukocytes. It has a characteristically segmented nucleus so that it may maintain the integrity of its genome under an increased load of reactive oxygen species (ROS) originating from its immunological activities. The potential for basophils to be used as markers of inflammation and allergy was first explored in 1991 whilst the technological basis for doing so using flow cytometry preceded it by 26 years. The prominence of basophil activation tests (BAT) has grow in research settings but is only in the introductory phases of clinical settings for the most part as of 2015. In 2011 it was still at the pilot stage as a diagnostic method for allergies to certain venoms and immediate drug hypersensitivity reactions (IDHR). According to the traditional Gell & Coombs hypersensitivity classification system, BAT is quantifying a Type 1 reaction based on the involvement of IgE for releasing histamine. However this is not helpful given that the classification system cannot adequately reflect a continually refined appreciation of the immune system. Understanding the principle underlying BAT first requires comprehending which relevant characteristics of basophils are changing and secondly, how flow cytometry quantifies them. Broadly speaking, the isolation and incubation of cells is the first step of BAT and the second one is the quantification of target cells by flow cytometry.
Figure 1 below depicts the steps by which masts cells release histamine, an immune and inflammatory mediator, in an IgE-FcεRI high-affinity receptor dependent manner. For all intents and purposes the mast cell can be substituted for a basophil in this example.
IgE antibodies presents the antigen to its IgE-specific FcεRI high-affinity receptor. When enough multivalent antigen cross-linking with adjacent IgE molecules occurs, the cytoplasmic granules fuse with the cell surface membrane and degranulate. This process involves the signal transducing transmembrane tetraspanin CD63 protein coming to the surface of the basophil. This is how it and similar protein CD203c serve as markers of basophil activation. Non-IgE dependent (otherwise named ‘direct’) basophil activation can be triggered by opiates, iodinated radio-contrast dye and antibiotics such vancomycin, β-lactams and quinolones. The mechanism via which this happens is not yet understood. Non-IgE dependent degranulation may partially explain the specificity shortcomings of the assay. Nevertheless, whether activation is mediated by IgE or otherwise, the histamines and other immune mediators released by basophils are involved in early and late-phase allergic reactions.
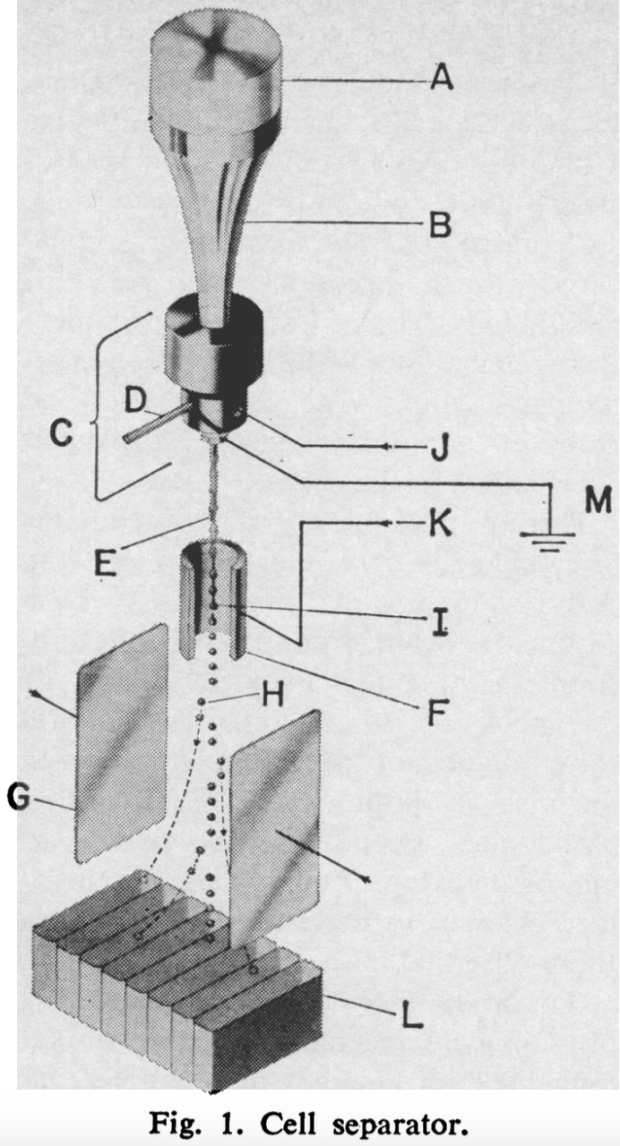
Inventor M. J. Fulwyler describes his early flow cytometry apparatus in below as essentially, a cell separator, saying “cell volume is measured in a Coulter aperture, and the cells are subsequently isolated in droplets of the medium which are charged according to the sensed volume. The charged droplets then enter an electrostatic field and are deflected into a collection vessel.” Figure 3 is the modern iteration of Fulwyler’s invention with an added laser-based component. Cell size is correlated to how the laser beams reflecting off of them scatters forwards and cell granularity correlates to the side scatter. Different lymphocytes have different granular contents. Separating cells according to their charge can still be used after the laser for further cell sorting.
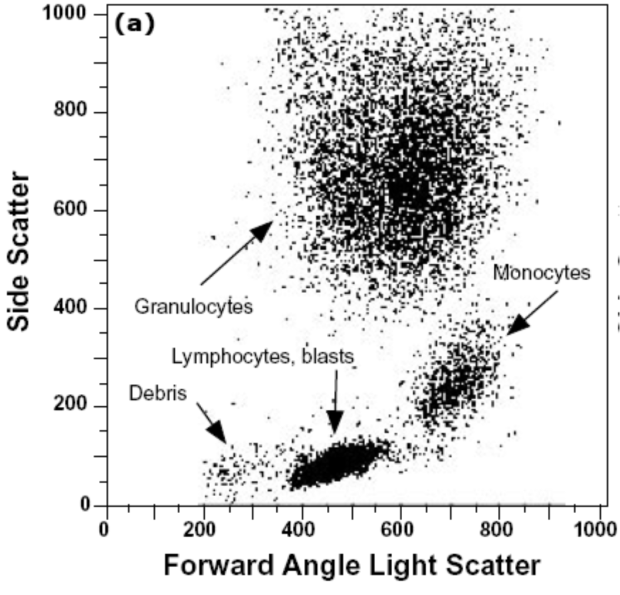
Figure 4 shows different populations of cells according to their forward and side scatter characteristics. Basophils are identified in the larger upper central cluster in the figure. The basic principle of how intensely light is reflected and scatters forwards and sideways enables flow cytometry to very precisely identify basophils amongst other molecules present in fluid samples. Furthermore, Subsets of basophils or ‘gates’ are identified using their surface markers like CD123/HLA-DR, CCR3/CD3 and IgE/CD203c.
The experiment use specific monoclonal antibodies complexed to fluorochromes to bind them. Fluorochromes reflect the laser beam which the flow cytometer records for use in subsequent data analysis. Using the same fluorescent signal for cell surface basophil activation receptors CD63 and CD203c, the number of activated basophils within those ‘gated’ subsets can be quantified on a single-cell basis. Figure 5 below depicts how IgE positive (IgE+) basophils are identified. First, Panel A plots the cells’ forward scatter by area and height (FSC-A and FSC-H, respectively). This produces aggregates (or distinct bands) from which basophils can be picked out from. Panel B then plots side scatter height (SSC_H) of the target aggregate against the fluorescent signal reflected by the complexed fluorochromes bound to IgEs. Both the amount of IgE basophils and of IgE on the cell surface is quantified.
Other BAT variations utilize markers of basophil degranulation such as inhibitory receptor Cd300a or “phosphorylation of intracellular signaling molecules such as p38 mitogen-activated protein kinase and signal transducer and activator of transcription (STAT)”. Alternatively, the diamine oxidase enzyme affinity HistaFlow technique can quantify intracellular histamine content. These techniques are not included in this assessment of BAT’s clinical utility. The technique focused on here uses forward and side light scattering as well as fluorochromes for IgE-dependent activation. Food allergen testing will be primarily applied to assessing BAT here.
In 2015, BAT’s in vitro ability to predict the severity of an allergic reaction to a variety of common food allergens was tested against the gold-standard double-blind placebo controlled food challenge (DBPCFC) in 67 patients by Song et al.. Skin prick testing (SPT), secretory IgE (sIgE), total IgE (tIgE), allergen-specific IgG4 (sIgG4) and peanut component-specific IgE (when applicable) were also measured and correlated to BAT. Patients were identified as ‘allergic’ based on an initial 3mm wheal SPT threshold and then administered DBPCFCs consisting of 2 grams of proteins cumulatively dosed from peanut, tree nut, sesame, fish, or shrimp. Positive reactions were graded on a 1 to 5 scale with 5 being the most severe. For BAT, the flow cytometer identified basophils if cells were CCR3+ with a low side scatter and amongst these, activated basophils if they were CD63+. BAT’s 3-dose response curve consisted of 200, 20 and 0.2ng/mL doses of crude peanut, pecan, hazelnut, cashew, sesame, catfish, cod, salmon and shrimp extracts. The negative control was interleukin-3 (IL3). One positive control consisted of an isolated allergen combined with a highly specific monoclonal antibody recognizing the high-affinity binding receptor Fc3RI and the other was the chemotactic peptide N-formyl-methionyl-leucyl-phenylalanine (FMLP). Each allergen has an optimal dose for eliciting maximal basophil activation and determining it is crucial for establishing a robust correlation between the severity of a reaction with a level of basophil activation.
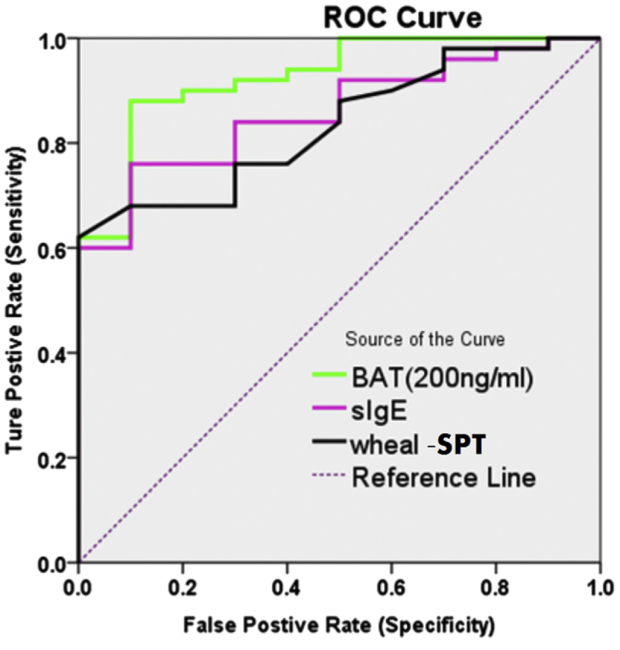
Figure 6 below plots the receiver operating characteristics (ROC) curve of BAT, sIgE and SPT using a binary classification system of ‘sensitivity’ and ‘specificity’. Sensitivity refers to the number of true positives identified as positive and specificity the number of true negatives identified as negative. The BAT results were dose-dependent which is an absolute requirement for starting to validate its use clinically. The highest BAT dose of 200ng/mL produced the greatest area under the curve (AUC) compared to sIgE and SPT, with a value 0.904. This dose was where the most sensitive and specific measures were seen amongst all 3 techniques. The 95% confidence interval for this result is 0.821-0.98 and is statistically significant with a P-value of less than 0.0001. Such a p-value means there is a 99.9999% chance that this result did happen by happenstance.
This is an excellent result for BAT. It adds support to the hypothesis that integrating it into clinical practice will reduce the need for DBPCFCs which are invasive and carry considerable risks. However, important caveats accompany the results. It should be kept in mind that this more traditional CD63 detection method is very specific to the IgE-mediated activation of basophils. This study did not utilize CD203c which “among hematopoietic cells, expression of CD203c is restricted to basophils, mast cells and their precursors, and has been described as specific for this lineage”. Hoffmann et al. have further argued that CD203c could be a more sensitive marker than CD63 for BAT. One on hand, results obtained by Song et al. using the traditional CD63 BAT marker are good because they covers a large segment of reactions in the population. On the other hand, they do not encompass non-IgE basophil activation reactions which are prominent in IHDRs. Despite using the less sensitive activation marker which potentially minimizes the results, this outcome may be partially skewed the other way (that is, positively) because tree nuts and peanuts activate basophils more aggressively than other allergens. It is worth visualizing the correlations in Figure 7 between the BAT dosing curve and DBPCFC scores in order to distinguish the statistical significance of a correlation with the strength of the correlation itself.
Going from left to right, the boxes in Figure 7 are 200, 2 and 0.2ng/mL doses of BAT allergens. For reference, a perfect correlation holds an ‘r’ value of 1. Despite the correlations all being statistically significant, they are quite weak, ranging from 0.32 to 0.5. Looking at the left-most box for example, multiple individuals had a basophil activation rate of 50% yet are found amongst 0 to 5 DBPCFC scorers. Authors Song et al. are more enthusiastic, saying there is in fact a “moderate correlation with clinical reactivity observed in this study [and this] is in line with results from prior studies demonstrating the sensitivity of the BAT”. They bolster this line of thinking by adding that it is a reasonable expectation stemming from the elucidated mechanism discussed above, whereby IgE is involved in basophil degranulation via FcεRIa receptor expression. Ultimately, BAT looks at one kind of allergic response mediated by this non-exclusive mechanism. Luengo and Cardona emphasize the complexity involved in predicting the degrees of allergic reactions by stating how “the risk of developing anaphylaxis depends not only on the allergen sensitization pattern, but also on the avidity and affinity of immunoglobulins to bind the allergen, the route of application, characteristics of the allergen and the presence of cofactors”. In fact, Song et al. pay tribute to this notion when discussing methods for predicting the severity of reactions to peanuts, saying “recent data have suggested that component-resolved diagnostics could be a better predictor of clinical reactivity [to peanuts] and could have some utility in predicting severity of symptoms”. This testifies to the stage of infancy immunology current finds itself in. Which markers best identify acute reactions, allergies or simple exposures are just starting to get teased out. For example, it is only recently that IgG4 has been deemed a better indicator of recent allergen exposure rather one of reaction severity.
BAT’s specific clinical utility regarding peanut allergies is worth exploring via a 2014 controlled study by Santos et al.. 1 primary study population (N=104) was divided into children allergic to peanuts (PA), children sensitive (PS) or not allergic to peanuts at all (NA). An independent population (N=65) was used to assess BAT’s performance in making diagnoses using flow cytometry. The BAT flow cytometry methods for assessing both the primary study population and the independent one were the same. Activated basophils were first identified using the SSClow/CD203c+ and CD123+/HLA-DR gates. Secondly, the activation levels of gated basophils were evaluated as a percentage of CD63+ ones and by the stimulation index of mean fluorescence intensity (MFI) of CD203c+ ones. Finally, the BAT dose curve for peanut allergens was established with a 10-point serial dilution covering 10µg/ml to 0.1ng/mL concentrations. The performance of BAT was assessed against oral food challenges (OFCs) followed by a DBPCFCs and other measures like SPT, peanut-sIgE and Ara h2-sIgE. Ara h2 is not a whole peanut allergen extract (peanut-sIgE) but a particularly allergenic protein in peanuts. The clinical implications the authors extrapolated from their study were that “the basophil activation test to peanut can be performed in cases in which standard allergy tests have failed to diagnose peanut allergy before considering oral food challenges”.
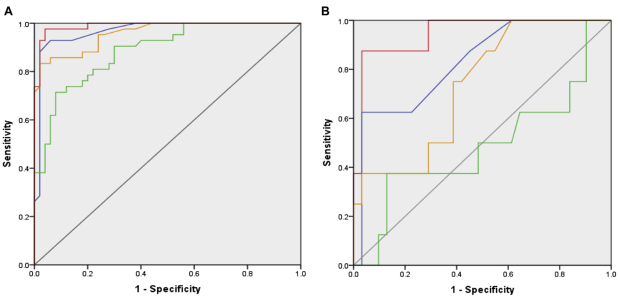
Indeed, within the cut-off values established in the independent study population, BAT’s ROC (green line) was superior to that of the other 3 with a value of 0.97, a sensitivity of 97.6% and specificity of 96.0%. This is represented in Figure 8 below. Panel A shows BAT’s ROC for children with an ambiguous SPT and sIgE history for peanuts and its components. Panel B highlights its ROC according to it performance at the 10 and 100ng/mL concentration points along the 10-point serial dilution.
BAT correctly diagnosed 96.7% of PA children identified via OFCs confirmed with DBPCFCs. Interestingly, BAT achieved the 2 largest clinically useful reductions in the amount of OFCs necessary for identifying PA children. When used as a secondary diagnostic tool following SPT 35 less OFCs are need. When used as a third one following SPT and Ara h2-sIgE 36 less OFCs are need. So far, the authors clinical recommendations appear warranted. However, the BAT assay for PS children cannot detect any significant changes in basophil activation. Furthermore, 11.5% of non-responders were found in the primary study population and 6.2% in the independent (external) one. This means BAT is incapable of identifying between 6 and 11 PAs in a room of 100 people. It is doubtful that BAT can be improved to identify many more PS or non-responders. It is more likely that the test is inherently limited, in the sense that it simply does not cover the entire range of immunological responses capable of inducing a peanut sensitivity or allergy. DBPCFCs remain the gold-standard.
The 2014 paper by Uyttebroek et al. titled “Basophil activation tests: time for a reconsideration” summarizes BAT’s limitations and in so doing carves out the best current and prospective uses for it in clinical settings. There has been wide clinical usage of BAT for IHDR despite ambiguous testing issues regarding the antibiotic fluoroquinolone. The latter has been reported to mediate non-IgE basophil degranulation and when using activation marker CD63, fails in terms of sensitivity and specificity or both when tested across 3 studies in a total of 56 patients. However, when activation marker CD203c is used in only 5 patients in 1 study, there is 100% specificity and sensitivity. Until further study, BAT is in fact potentially confounded by fluoroquinolones. BAT’s sensitivity to NSAIDs – a globally and widely prescribed class of anti-inflammatory agents – is too low for clinical use. However, the authors predict than within 5 years BAT and HistaFlow will receive mainstream implementation for IgE and non-IgE mediated IDHR, respectively – assuming those IDHRs are underpinned by basophil or mast cell (effector cells) degranulation. All considered as of 2014, BAT’s sensitivity and specificity varies between 75% and 95%. Despite its niche use for peanut testing in a second or third diagnosis-reinforcing option, Uyttebroek et al.’s 5 year review of the literature has not uncovered any novel diagnostic applications for BAT in the field of food allergies.


