Diet principles I wrote for my gym with a focus on low-carb keto diets by request

Nothing in biology makes sense except in the light of evolution

Theodosius Dobzhansky (1973)

  • All food is composed of 1 or more of the 3 macronutrients
        • protein (made from amino acids; like leucine, tryptophan, glutamine…)
        • carbohydrate (made from sugars; like starch, sucrose, lactose, dextrose…)
        • fat (made from fatty acids; like palmitic acid, oleic acid, cholesterol…)
  • All food contains a variety of micronutrients
        • minerals (atoms like Magnesium, Sodium, Copper…)
        • vitamins (like Vitamin A, Vitamin B, Vitamin E…)
  • All animals have essential and non-essential macronutrients and micronutrients
        • The non-essential ones are those their bodies can make and the essential ones are those their bodies cannot make and so must obtained from their food or water
  • 2 essential macronutrients for humans
        • fat
        • protein
  • ~ 40 essential micronutrients for humans
      • 15 essential minerals
        • Potassium (K), Chloride (Cl), Sodium (Na), Calcium (Ca), Phosphorous (P), Magnesium (Mg), Iron (Fe), Zinc (Zn), Manganese (Mn), Copper (Cu), Iodine (I), Chromium (Cr), Molybdenum (Mo), Selenium (Se), Cobalt (Co)
      • 14 essential vitamins
        • Biotin, Folic acid, Niacin, Pantothenate, Riboflavin, Thiamine, Vitamin A, Vitamin B6, Vitamin B12, Choline, Vitamin C, Vitamin D, Vitamin E, Vitamin K
      • 2 essential fatty acids (from fats)
        • omega 3 (ω-3) fatty acid Docosahexaenoic acid (DHA)
        • omega 6 (ω-6) fatty acid Arachidonic acid (AA)
      • 9 essential amino acids (from protein)
        • Phenylalanine (F), Valine (V), Threonine (T), Tryptophan (W), Methionine (M), Leucine (L), Isoleucine (I), Lysine (K), Histidine (H)
      • 6 conditionally essential amino acids (from protein)
        • Arginine (R), Cysteine (C), Glycine (G), Glutamine (Q), Proline (P), Tyrosine (Y)
      • Humans are obligate carnivores but preferential omnivores
        • all of our essential macro and micronutrients can only be obtained from animals
          • only some of our essential macro and micronutrients can be obtained from plant foods
        • historically, humans have nearly always eaten a mixture of animals and more or less plants
      • It is more correct to say that humans are adapted to certain properties of foods rather than say that humans are adapted to this or that food


Individualizing diet

Understanding that “humans are adapted to certain properties of foods” we can then visualize foods and their hierarchy in a healthy diet for humans, using Dr.Naiman’s (@tednaiman) Food Pyramid.Ted Naiman low-carb food pyramid

Unhealthy foods for all humans

The following 3 kinds of foods are what the vast majority of processed (‘junk’) food is made of. However, they are also found in unprocessed forms and said to be healthy – this is false.

  • Cereal grains (wheat, maize/corn, rye, barley oats, spelt, teff…)
      • this includes their processed flour forms (croissants, cakes, bread, muffins…)
  • Vegetable oils (soybean oil, corn oil, cottonseed oil, canola oil, sunflower soil, rapeseed oil, grapeseed oil, safflower oil, rice brain oil…)
  • Sugar, processed out of their original foods (Agave nectar, Beet sugar, Cane sugar, Caramel, Corn syrup, Dextrose, Fructose, Galactose, Molasses – there are ~56 different names!)

Healthy foods for all humans

*assuming no allergies or rare diseases

Ted Naiman low-carb food

Personalize the Food Pyramid/Guide

  • Grey Area foods
    • foods that can be part of a healthy diet for a minority of people because either (1) the food has not very many of the properties humans are adapted or (2) it has too many properties that humans are not adapted to (like anti-nutrients)
    • Dairy is a ‘grey area’ food
      • if you eat dairy, it should always be full-fat and raw
      • do not eat dairy if, after testing, you notice negative symptoms (allergies, poor digestion, loss of focus, joint pain…)
      • do not eat dairy, according to the precautionary principle, if if you have an autoimmune disease (asthma, celiac, multiple sclerosis…) or cancer
    • Legumes (from Fabaceae family) are a ‘grey area’ food
      • examples:  peas, beans, lentils, soybeans, peanuts…
      • if you eat legumes, (1) they should be a small part of your diet that does not displace essential animal foods because you cannot rely on them alone for adequate micronutrition and (2) they should not lead you to exceeding your level of carbohydrate tolerance
      • do not eat legumes (or eat very little of them only occasionally) if (1) you are on a low-carbohydrate diet or (2) if, after testing, you notice negative symptoms (allergies, poor digestion, low of concentration, joint pain…)
      • do not eat legumes, according to the precautionary principle, if if you have an autoimmune disease (asthma, celiac, multiple sclerosis…) or cancer
    • Rice is a ‘grey area’ food
      • Rice is a cereal grain which humans are poorly adapted to because, generally, they contain high levels of anti-nutrients, many indigestible elements, a lack of sufficient essential amino acids and fatty acids as well as being very high in starch (carbohydrates)
      • White rice is probably the least harmful cereal grain because it is stripped of many of its anti-nutrients and is mostly plain starch
      • do not eat white rice if, after testing, you notice negative symptoms (allergies, poor digestion, low of concentration, joint pain…)
      • do not eat white rice, according to the precautionary principle, if if you have an autoimmune disease (asthma, celiac, multiple sclerosis…) or cancer
    • Potatoes are a ‘grey area’ food
      • if you eat potatoes, (1) they should be a small part of your diet that does not displace essential animal foods because you cannot rely on them alone for adequate micronutrition and (2) they should not lead you to exceeding your level of carbohydrate tolerance
      • do not eat potatoes (or eat very little of them only occasionally) if (1) you are on a low-carbohydrate diet or (2) if, after testing, you notice negative symptoms (allergies, poor digestion, loss of focus, joint pain…)
      • potatoes are not a food you need or should be eating if diabetic or trying to lose weight
    • Sweeteners
      • do not use sweeteners if, after testing, you notice negative symptoms (allergies, poor digestion,loss of focus, joint pain…) and difficulties with appetite or weight loss
      • if you use sweeteners, they should not cause you to crave more sugary/starchy foods
  • Allergies to usually healthy foods
      • for example, if you are allergic to a shellfish or a certain fruit, do not eat it
  • Carbohydrate tolerance
      • historically, humans mostly ate a lower-carbohydrate diet
        • 16%-22% carbohydrate was the most common and 29%-34% carbohydrate was the next
      • in 2016, no modern population is healthy on a high-carbohydrate diet (65%-75% carbohydrate)
      • however, there are a few but important non-industrial examples of healthy groups (Kitava, Tokealau…) eating high-carbohydrate diets
      • if you suffer from diseases (diabetes, obesity, heart disease, cancer…) you should not be on a high-carbohydrate diet and should eat a low-carbohydrate or ketogenic diet


What we are (mainly) trying to avoid

We want to avoid being ‘hangry’ (hungry + angry = hangry). We can understand it better by once again looking at my friend Dr.Naiman’s (@tednaiman) diagram of the simplified physiology.

hangry ted naiman

Carbohydrate tolerance

The best, widely available, clinical test for figuring out your carbohydrate tolerance measures your sensitivity to the hormone insulin. You can ask your doctor for a 2hr Oral Glucose Tolerance Test (OGTT) with insulin assay. Your doctor might not order it for you if you are not diabetic or pregnant so you might have to pay for it directly.

  • The test
    • at time 0 (T0), the nurse takes 2 fasting blood samples, 1 for your glucose & 1 for your insulin
      • you then drink 75g-100g of a (medical) glucose drink
    • 30min later at T1, the nurse takes 2 ‘fed’ blood samples, 1 for your glucose & 1 for your insulin
    • 30min later at T2, the nurse takes 2 ‘fed’ blood samples, 1 for your glucose & 1 for your insulin
    • 30min later at T3, the nurse takes 2 ‘fed’ blood samples, 1 for your glucose & 1 for your insulin
    • 30min later at T4, the nurse takes 2 ‘fed’ blood samples, 1 for your glucose & 1 for your insulin
  • What the test tells you
      • it measures how well your body handles the glucose you drank
      • you want to be a Kraft Pattern I: the other responses are pre-diabetic, type 1 or 2 diabetic

Screen Shot 2016-07-20 at 16.18.55


Ketogenic diets

  • Basics
      • very low in carbohydrates (< 15%-10% carbohydrate; usually < 10%)
      • moderate in protein, not high-protein diets (< 25%-20% protein; usually ~20%)
      • high in fats (>65%)

A ketogenic diet is called “ketogenic” because eating this way turns some of the fat in your diet and in your body into molecules mainly used for energy called ketones: acetoacetate, acetone and β-hydroxybutyrate. Being ‘in ketosis’ is not an exact thing but usually means having more than 0.5mmol/L of β-hydroxybutyrate (BhB) in your blood.

  • Adaptation period
        • getting your body used to (1) using much more fat than carbohydrate for energy and (2) using much more animal fats (from beef and sardines for example) than processed vegetable oils (like canola and sunflower oil) for maintaing your basic biology
        • the time and difficulty in getting fully keto-adapted depends on (1) your general health, (2) your genetics and (3) your compliance to the diet
        • short-term adaptation
          • the 2 to 8 weeks it takes for most people to ‘feel good’ (or normal) after switching from a higher-carbohydrate modern Western diet to a well formulated ketogenic diet
        • long-term adaptation
          • the couple of months or +1year it can take athletes to perform the same or better at their activity or sport
        • Women, physiologically, can adapt to a ketogenic diet as well as men can. However, cultural differences may present women with a few more challenges
          • (1) they are often expected to ‘cut calories’, giving them lower energy levels
          • (2) they are told even more than men that ‘fat makes you fat’ which is false
          • (3) the fluctuations in mood and energy that often come with menstruation can make an already challenging adaptation even more uncomfortable; it will pass!
        • Men tend to be less patient than women, finding it harder to take a short break from their ‘performance goals’ to properly keto-adapt.
        • ketogenic diets are diuretic, meaning they make you pee more, leading to an increase loss of minerals (salt, potassium, magnesium…)
          • (1) this is a normal, healthy response (doctors tell us ‘the less salt the better’, this is false)
          • (3) mineral loss often causes negative symptoms some people have whilst keto-adapting
          • (4) if you feel low in energy, have a headache or heart palpitations, supplement with salt, potassium and/or magnesium
          • (5) add salt to your food using (a) your taste and (b) your sense of well-being afterwards
  • Factors influencing ketosis
      • the more exercise we do, the more grams of protein or carbohydrates we can eat without getting out of ketosis
      • being stressed (for e.g., releasing lots of cortisol) can temporarily lower blood ketone levels
      • the better you sleep, the easier it is to be in ketosis
        • sleep quality depends on (1) duration [how long…], (2) frequency [how many times you sleep in a 24hr cycle…], (3) quality [how ‘deep’ your sleep is, how complete and effectice your sleep cycles are]
      • omega-3 fats from fish (like sardines and mackerels) seem to help people get into ketosis more easily, although it is not known why

Ketogenic-specific Food Pyramid

This is a ketogenic food pyramid by Luis Villasenor’s (@ketogains). It has quantitative recommendations for health and performance goals.

keto gains food pyramid

Questions? raphi.inter[at]gmail.com

Cholesterol, Pauli Ohukainen & Authority

No. Just that it’s always the totality and magnitude of all risk factors over a lifetime that ultimately determines when CVD hits

So it’s multifactorial? Sure. But you see, saying that explains everything and anything. Or, nothing…A good theory unifies these disparate factors. That’s what we failed to do in medicine so far. And risk factors are just that, statistical associations. A theory does away with those statistical artefacts that are mere associations and identifies only those relevant, causal elements. The 2 hypotheses that feed into one another, the Diet-heart hypothesis (fat => cholesterol => bad) and Cholesterol-CVD hypothesis (cholesterol blocks arteries) have both been falsified. First off, there are multiple associations which falsify the both theories: midle-aged women have lower all-cause mortality the higher the cholesterol, Japanese cohorts don’t see increased risk of death or CVD with higher LDLc or TC, the supposed French Paradoxes etc..It’s important to note that you don’t need to weigh the number of associations supporting & not supporting your hypothesis; (assuming the associational study is well done – granted, a big ‘if’) all that is needed is a single association that doesn’t fit your hypothesis and that is enough to have it thrown out. All the other favorable ones be damned!

Although LDL’s causality is inferred from many independent lines of evidence, it may not always predict a clinical event.

This is where peopole in medicine and nutrition need to wake up: IF YOUR THEORY FAILS IN ITS PREDICTIONS, ITS A SHITTY THEORY. We need to realize that the fields of medicine & nutrition are the alcoholics of the science world: the first step for solving a problem is realizing & admitting we have one. Mainstream advice for weight loss, diabetes, CVD, cancer, alzheimers etc. SUCKS! Why? No good working theory. Neither about what causes these diseases or what revereses them. We fail to admit we cannot predict, to any useful degree, who will get it & why. We rather brandish the Multifactorial Flag – a useless truism & tautology mostly – so that we can hide & excuse our ignorance, pretending there is no general lack of scientific acumen amongst researchers.

sunday-smiles-we-might-fail-at-science-but-we-L-gMQubL

So how ’bout dem receptor kinetics? Part of the ‘great work’ or ‘misapplied findings’?

What about receptor kinetics? What are you expecting the Michaelis-Menten constant (Km), in and of itself, to tell you about the causal process of CVD? You can do all the molecular biological work you want, but that will not replace animal & human models with controlled variables and well donce associational studies falsfiying predictions (or anything you might see in in vitro for that matter). I study molecular biology and can honestly say that Brown & Goldstein’s work to elucidate the FH gene is impressive and exemplar of good science for aspiring researchers. Credit where credit is due. But this isn’t politics, so there are no ‘carry over credits’ for the other claims they make using their original discovery. On day 1 of a genetics course, you understand that although there is ‘the gene for X’, this is in NO WAY A GUARANTEE that only X is affected by the gene encoding it. The nuclear DNA library is a vanishingly small fraction of the story of how phenotype emerges from genotype. The way laymen & the majority of doctors I know, really do not understand genetics. I would count myelf in that group until about 2010. Furthermore, my understanding of epigenetics has completely changed in the past 4 months after reading Mark Ptashne’s work. In fact, many *geneticists* talk a lot of nonsense about epigenetics (as I did previously). No one needs to take the word of Nobel Laureates. That’s the beauty of it all, we can and should scrutinize their ideas. The findings of Brown & Goldstein do not support Cholesterol-CVD hypothesis; rather interestingly, it open up a door to the pivotal role cholesterol plays in the maintaing epithelial integrity and how this affects its interactions with solutes in the blood. Cholesterol IS important in CVD, but not as an inherently negative agent.

Cancer: linking metabolism to genetics

The currently accepted, mainstream theory of cancer

Cancer is taken to be a ‘genetic disease’ at heart. This is because the currently accepted Somatic Mutation Theory (SMT) posits that mutations in the nuclear genome are the fundamental etiological drivers of the disease. These mutation are thought to arise when “an individual mutant clone of cells begins by prospering at the expense of its neighbors through a microevolutionary process of clonal selection. The nuclear genomes of cancer cells are mutated, disorganized and unstable, and outside their nucleus metabolism is abnormal. Under the SMT umbrella, this metabolic abnormality is assumed to be a downstream symptom of the mutated nuclear genome, a hallmark of the disease but not its causal agent.

A much less popular but competing theory of cancer

A competing theory, the Metabolic Theory (MT) of cancer, effectively reverses this arrow of causality. From nuclear mutations causing abnormal metabolism we got to abnormal metabolism causing nuclear mutations. It postulates that faulty oxidative phosphorylation (OxPhos) – the end stage of cellular respiration – is the root cause of cancer. Consequently, the 6 hallmarks of the disease, angiogenesis, evasion of the immune system, evasion of death, evasion of growth suppressors, invasion and metastasis, and finally sustained proliferative signaling, all follow on from this metabolic abnormality. What the latter presents as is the continued expression of glycolysis in the presence of oxygen, also known as the Warburg effect.

Linking abnormal OxPhos to gene regulatory mechanisms

Whether mutations cause cancer or simply emerge in the cancerous cell as a result of defective OxPhos, it remains important to investigate the links between our genetic profile, both in terms of our base DNA code, gene regulatory networks and epigenetic fingerprints. Initially, genetic features of cancer was limited to abnormal karyotypes, like a different number of chromosomes (or aneuploidy), and somatic mutations. With the advent of epigenetics and a deeper understanding of gene regulatory phenomena, we have at least two additional avenues down which we may potentially learn to better profile cancer cells. This is true regardless of which theory of cancer one operates under.

The question I wish to explore here is Which gene regulatory mechanisms are linked to dysfunctional OxPhos in cancer? The relevant laboratory and software techniques are discussed first, followed by the particular mechanisms underlying the disease, hopefully helping to further elucidate the merits and demerits of both theories.

Definitions: genetic vs epigenetic changes

Before delving into data gathering techniques, a clear and parsimonious exploration of the question necessitates defining genetic, epigenetic and broader gene regulatory phenomena.

Genetic changes

Genetic changes or mutations refer to alterations in base genetic code, whether that be different nucleotides, their order in a sequence, the orientation of a sequence, the translocation of a sequence or the number of times a sequence repeats.

Epigenetic changes

As for epigenetics, in 1952 Waddington used the term quite broadly “to refer in general to what we now know to be changing patterns of gene expression that underlie development and that are oſten triggered by signals sent from other cells. According to the 2014 6th edition of Molecular Biology of the Cell, the covalent modification of histones in nucleosomes falls under an epigenetic “form of inheritance that is superimposed on the genetic inheritance based on DNA. Mark Ptashne argues that the covalent modifications of histones is not an epigenetic mechanism given that “the enzymes that impose such modifications lack requisite specificity; the modified states are not self-perpetuating; and the roles played by the modifications remain for the most part obscure. Experimentation tells us that “histone modifications are not maintained as cells divide. These histone modifying enzymes are part of a response to epigenetic regulation and not a cause thereof. According Ptashne’s criteria, histone modifications fall under the more general category of gene regulation, leading to a more narrow definition of epigenetics. This definition includes the phenomena of memory (“continual activities of the specific regulators to maintain that state of expression”) and specificity (“activating one gene or set of genes and not another”). One epigenetic mechanism may employ a positive feedback loop (such as the auto-activation of the cl gene) and another, a negative feedback loop (like the auto-repression of the cl gene). Examples of epigenetic in nature include viral immunity passed down to the next generation or transient inflammatory stimuli causing chronic inflammation via feedback-loops mediated by sequence-specific microRNAs (or other regulatory proteins).

Gene regulatory changes

Gene regulatory changes result from the activity of gene regulatory networks governing the gene expression levels as seen in mRNA and proteins. These networks respond to environmental cues that could be anything from food and light to psychosocial events and drugs.

Detecting cancer

Now that we’ve got our definitions lets talk about about techniques to detect cancer. An early cancer diagnosis, or better yet anticipating the transition of a benign tumor to a malignant one, is of utmost importance in reducing cancer associated deaths. For this reason, assays detecting DNA methylation patterns regulating gene expression and activities of their upstream enzymatic effectors have become of great interest. They are the subject of Shinjo and Kondo’s 2015 paper upon which most of the following analysis is based. A point of note, unlike Mark Ptashne these authors consider DNA methylation to be an epigenetic phenomenon.

DNA methylation

DNA methylation pattern assays first require differentiating methylated DNA from unmethylated DNA, which can be done physically, using a methyl-binding column, or by inducing sequence changes through bisulfite treatment, for instance. Other techniques based on sequence changes include the use of restriction enzymes of varying sensitivity to DNA methylation sites, as well as methylated DNA enrichment with anti-cytosine or methyl-binding anti-bodies. DNA methylation appears to be stable in cancers and can thus be relied upon to establish methylation patters related to gene expression.

DNA methylation pattern assays can be conducted on samples of cell-free DNA (cfDNA) found in blood, stool, urine, tissue and other bodily fluids. Although cancer cells resist apoptosis, the disease process results in higher overall rates of apoptosis and tissue necrosis. This leads to increased levels of cfDNA circulating in the blood which can be indicative of a loss of heterozygosity and the presence of mutations. For example, blood samples of cfDNA have shown RASSF1A DNA demethylation associated with increased sensitivity to cancer treatment. The converse is also true, decreased sensitivity to treatment is associated with increased methylation.

Methylation tests on fecal, urine and sputum samples each use different biomarkers and do not all perform equally well. For stool samples, Cologuard™ uses NDRG4, BMP3 and KRAS mutation methylation biomarkers showing 92.3% sensitivity and 86.6% specificity. For urine samples, the GSTP1 methylation biomarker shows 88% sensitivity and 60% specificity. For sputum samples, the Epi prolung test uses the SHOX2 methylation biomarker showing 60% sensitivity and 90% specificity.

Gene regulatory imprints

Cancer treatments directly targeting gene regulatory mechanisms broadly cover 3 areas; histone modifications, DNA methylation associated pathways and readers of gene regulation.

Regarding the first area, there are 18 known histone deacetylase inhibitors (HDIs) divided into classes 1 through 4 with which to work with. They stop the deacetylation of lysine (K) and are associated with the restoration of silenced genes, the induction of growth arrest, the interruption of differentiation and the prompting of tumor cell apoptosis. HDI based cancer treatments are still quite new. Currently there are only 3 FDA approved HDIs in the United States of America: Vorinostate, Romidespine and Belinostat.

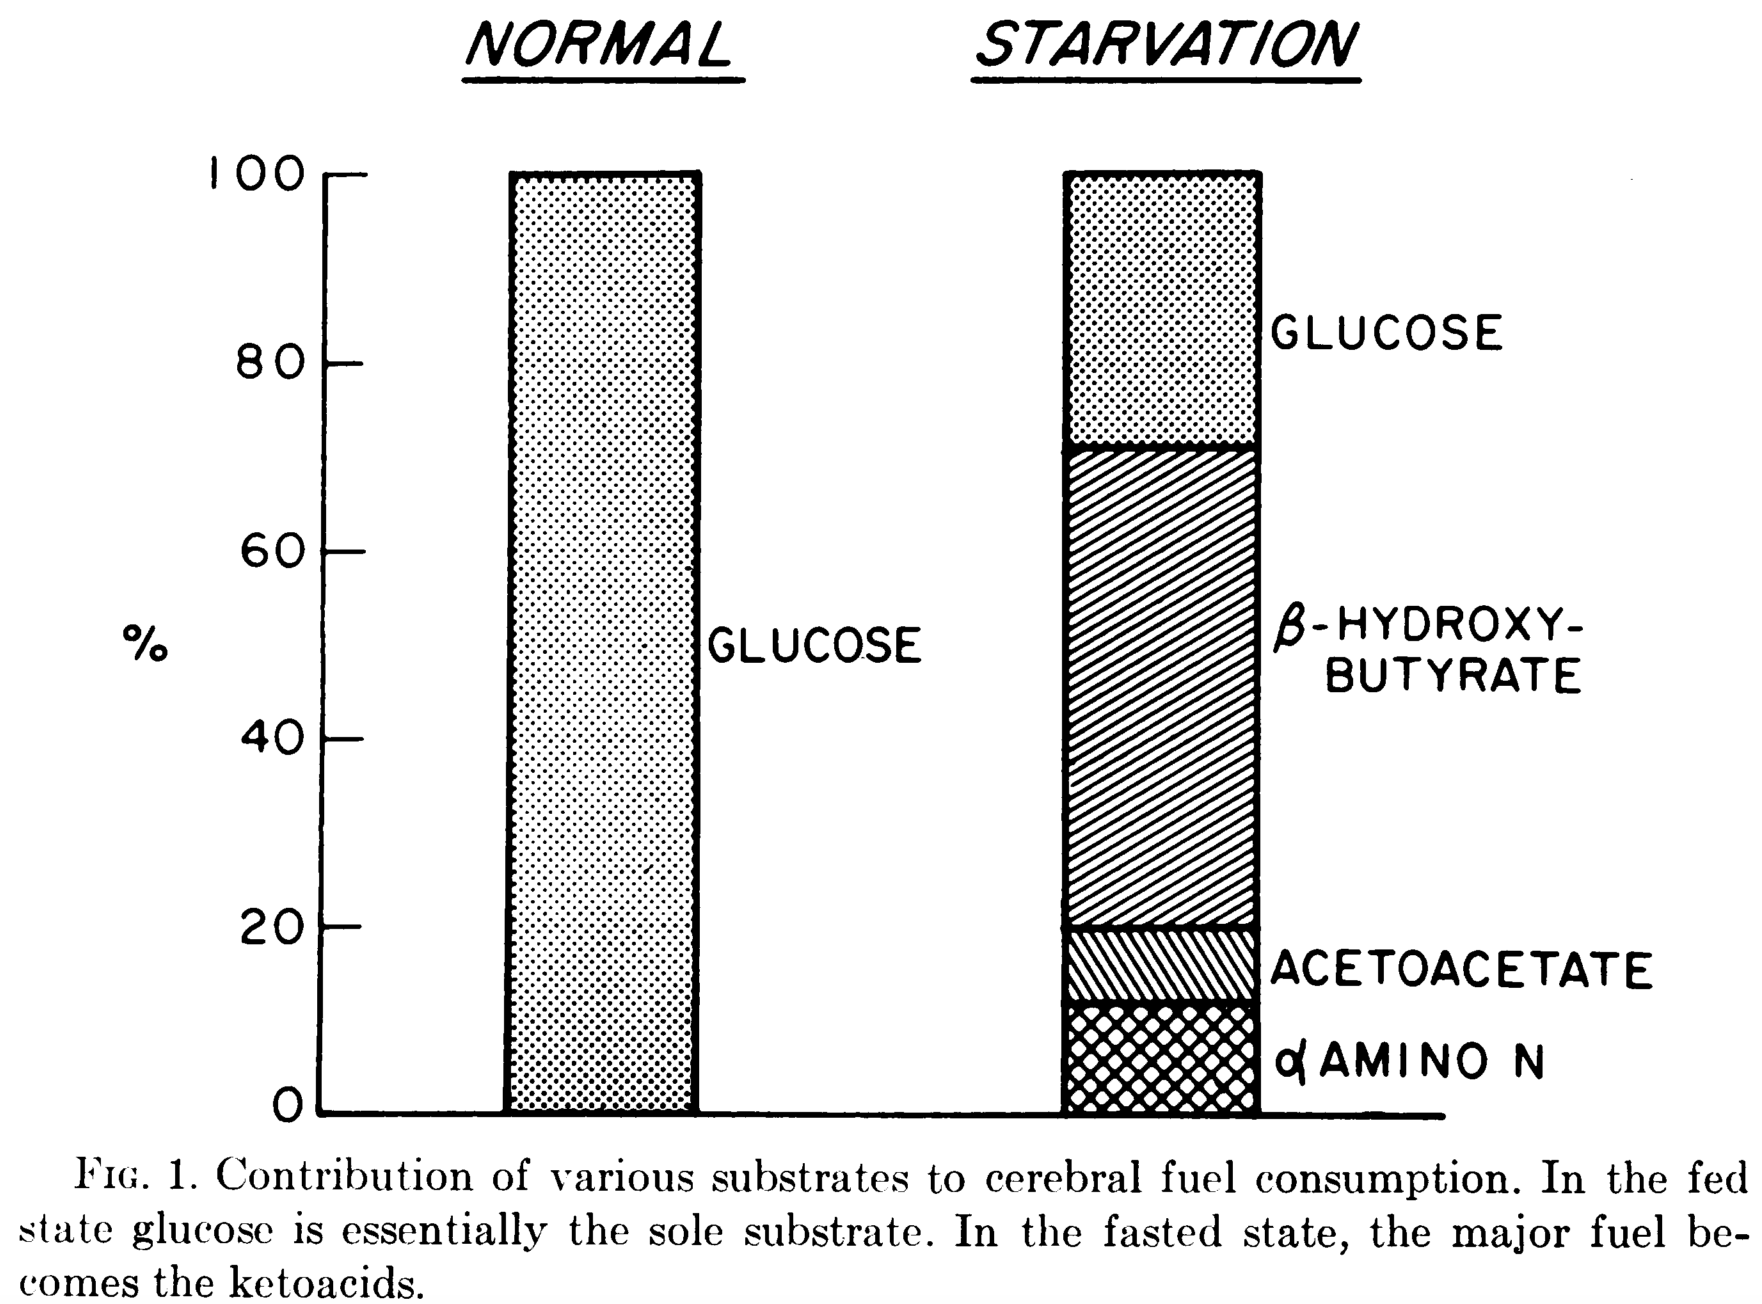
Regarding the second area, DNA methyltransferase inhibitors (DNMT1 inhibitors) are equally novel and only one has been approved for myelodysplastic syndromes (MDS) therapy – bone marrow cancers. The mechanism of action of another such molecule is illustrated in Figure 1 below, taken from Shinjo and Kondo’s paper. IDH1 usually catalyzes the oxidatively decarboxylation of isocitrate to α-ketoglutarate (α-KG) which has for effect of replenishing the TCA cycle. IDH-1 mutants divert α-KG towards the catalysis of oncometabolite 2-HG. As the latter accumulates it inhibits α-KG-dependent dioxygenases, histone demethylases and TET family proteins. IDH-1 inhibitors therefore interfere with 2-HG accumulation.

The third area is concerned with cancer treatments exploiting molecules capable of interfering with gene regulatory ‘reading’. Bromo and Extra Terminal proteins (BETs) read the code of histone modification, particularly acetylated histones. BET inhibitors bind particular residues of histone modification, effectively out-competing bromodomain-competing proteins (BRDs) of the BET family. For example, fusion oncoprotein BRD4 is displaced from chromatin by BET inhibitor I-BET151, thereby decreasing the oncogenic transcription potential of BCL2, C-MYC (cytoplasmic myelocytomatosis oncogene) and CDK6.

IDH1-mutant

Figure 1. IDH1-mutant

Chromatin Immunoprecipitation Sequencing (ChIP-seq) assays are used to map the genome-wide binding of gene regulatory proteins. For example, this technique reveals the different binding patterns of the Sirtuin1 protein (Silent Information Regulator 1) in the nucleus accumbens of rats before and after the administration of cocaine over 7 days. ChIP-seq in conjunction with RNA and immunoblotting assays can link posttranslational modifications made to newly synthesized histones and the subsequent patterns of gene expression found at specific genomic loci affected by this chromatin assembly. Yang et al. applied this combination of techniques to show ”how one modification that occurs on newly synthesized histone H3, acetylation of K56, influences gene expression at epigenetically regulated loci in Saccharomyces cerevisiae. Essential information about cellular behavior is obtained with ChIP-seq. Other programs are then used to map relationships between these patterns of immuno precipitated chromatin.For example, RNA-seq visualization tool Cascade does just that for copy number variants (CNVs) and the MAP2K4 pathway of ovarian cancers, visible in Figure 2 below. It can then form the basis of further experimentation involving the in vivo alteration of chromatin patterns associated with malignancy, in the hopes of impeding tumor progression.

RNA-Seq Cascade

Figure 2. RNA-seq visualization tool Cascade for ovarian cancer CNVs & MAP2K4 pathway

Sirtuins

The first mechanism explored here involves sirtuin proteins 1 to 7. According to Mark Ptashne’s their criteria fall under the category of gene regulation. Amongst the 7 sirtuin proteins, those of particular note are sirtuins 3, 4, 6 (and 7 to a lesser degree) because of their pronounced ability to suppress the Warburg effect as a function of their gene regulatory capacities. Sirtuins are NAD+-dependent class III histone deacetylases (HDACs) catalyzing ADP-ribosylation reactions which can loosen chromatin. This effectively makes DNA more or less accessible, as well as facilitate or hinder the activities of histone effector proteins. These sirtuins are most directly involved in cancer via their action on the Warburg effect. This is because their activities depend on the NAD+/NADH ratio, a general indicator of metabolism, and more specifically cellular redox state and energy status. NAD (the reduced form of NAD+) and NADH are physiological sirtuin inhibitors whilst NAD+ and resveratrol are sirtuin-activating compounds (STACs). The following discussion of sirtuins 1 to 7 is based on Kleszcz et al.’s 2015 paper as well as Douglas Wallace’s 2014 NIH presentation “A Mitochondrial Etiology of Metabolic and Degenerative Diseases, Cancer and Aging.

Sirt6

SIRT6 is found only in the nucleus and is particularly interesting amongst sirtuins, in large part because of its co-repression of transcription factor MYC (myelocytomatosis oncogene). This repression is associated with both the inhibitions of glycolysis and ribosomal activity. In cancer cells, the nucleoli containing ribosomes have the striking morphological feature of being engorged due to increased biosynthetic demand. Non-transformed cells lacking SIRT6 become tumors when glycolysis is intact but fail to do so when it is abolished, a pattern which strongly argues that the Warburg effect drives tumorigenesis. Like for most sirtuins, SIRT6’s tumor-suppressing effect depends on the cell type and disease stage. Nevertheless, SIRT6 over-expression affects chromatin structure such that cancer cells will apoptose but normal cells won’t. One way this is thought to occur is through the H3K9 deacetylation of the Hypoxia-Inducible Factor-1α (HIF-1α) gene promoter. When HIF-1α is stable in cancer cells pseudorespiration is ongoing. This occurs when ATP is produced through mitochondrial fermentation involving substrate-level phosphorylation. The cancer cell is less sensitive to apoptotic signals when the HIF-1α complex is stabilized. Fortunately, SIRT6 over-expression can destabilize it. Furthermore, mouse models of liver cancer have shown that the ‘genome guardian tumor suppressor p53 can induce SIRT6 expression so as to inhibit hepatic gluconeogenesis. This underscores a mechanism for p53 in the maintenance of glucose homeostasis.

Sirt3

Other sirtuins affect HIF-1α stability such as SIRT3 which is found both within the mitochondrial matrix and nucleus under normal growth conditions. Downregulation of its activity effectively reprograms metabolism such that an increased level of reactive oxygen species (ROSs) signals HIF-1α stabilization. This in turn upregulates glycolytic enzymes. SIRT3 impedes aerobic glycolysis and thus the production of lactate through an additional pathway involving pyruvate dehydrogenase E1α (PDHA1). The deacetylation of lysine 321 on PDHA1 will increase its activity, diverting and increasing glucose utilization through the Citric Acid Cycle (TCA). Like SIRT6, SIRT3 appears to suppress or promote tumorigenesis depending on the cell type as well as the confluence of stress and apoptotic stimuli. Inflammation is one such stressor typically present in tumors and can be attenuated by fasting in human subjects. SIRT3 is NAD-dependent (or ‘nutrient sensing’) and when fasting, its activity diminishes. This has for consequence of blunting the response of the NLRP3 (NOD-Like Receptor family Protein 3) inflammasome.

Sirt4

Metabolism is inextricably interwoven with biosynthetic demand given their functional interdependency. This is exemplified in the interaction of the mammalian target of rapamycin complex 1 (mTORC1) and SIRT4. The latter is only located in the mitochondrial matrix and is involved in balancing the oxidation and synthesis of fatty acids. mTORC1 however is a general growth promoter. Its activation will upregulate glutamate dehydrogenase (GDH) via SIRT4 repression and in so doing enable cancer progression. This enhanced glutamine metabolism both replenishes TCA cycle intermediates required for biosynthesis as well as serve as fermentable substrate contributing to filling the energy gap resulting from the cancer cell’s defective oxidative phosphorylation. Interestingly, sufficiently extensive DNA damage can induce SIRT4 expression and shut down glutamine metabolism, a requisite process for cellular repair. This sirtuin appears to suppress the formation of tumors by inhibiting excessive glutamine metabolism and maintaining genomic stability.

Sirt1

SIRT1 is the most highly conserved sirtuin in mammals and is found both in the nucleus and cytoplasm. It modulates the metabolism of lipids and glucose in the liver, insulin secretion in the pancreas and engenders fat mobilization in adipose tissue. All of these features together point to SIRT1 as a key metabolic sensor. SIRT1 negatively regulates phosphoglycerate mutase 1 (PGAM1) which is upregulated in many cancers and occupies an important point in the glycolytic pathway where many glycolytic intermediates upstream of it serve as biosynthetic precursors. SIRT1-mediated deacetylation of PGAM1 will thus reduce glycolysis, flux down the pentose phosphate pathway (PPP). The levels of the aforementioned biosynthetic intermediates will thus be lower too. This all serves to inhibit tumor growth given the tumor’s reliance on these factors. Like other sirtuins, SIRT1 also demonstrates tumor suppressive action mediated by HIF-1α deacetylation. This sirtuin, like others in its family, has its tumor suppressing capacities contrasted by context-dependent tumor promoting ones. Through its deacetylating activities it can promote tumorigenesis by inhibiting p53, p73 and HIC1 (Hypermethylated In Cancer 1). Given how common it is for genes and gene regulating molecules to both suppress and promote tumorigenesis, they should not be viewed as solely doing one or the other, but rather as sitting at the intersections in cell pathways leading towards or away from growth. The same analogy can be applied to the gene themselves, implying that terming them ‘oncogenic’ may have been premature and now thoroughly confusing.

Sirt2

Along with SIRT1, SIRT2 is also located in both the cytoplasm and mitochondria. It is yet another sirtuin that, when overexpressed, can destabilize HIF-1α under hypoxic conditions. Experiments with cells that do not express SIRT2 corroborate this fact given that they fail to affect HIF-1α levels. SIRT2 positively regulates PGAM as opposed to SIRT1’s negative regulation. SIRT2 deacetylates K100 (lysine100) on PGAM, thereby upregulating its activity and thus glycolysis. This sirtuin is mainly found in the cytoplasm and shuttles back and forth to the nucleus. The significance of sirtuin localization is not yet known. However it is interesting to consider the possibility that the direction in which they carry out their activities (either from nucleus to cytoplasm or cytoplasm to nucleus) might explain their context-dependent pro- or anti-tumorigenic effects. During the study of breast tumors, SIRT2 was shown to have both tumor suppressive and promoting capabilities. Here however, tumor grade appeared decisive rather than cell type.

Sirt5 and sirt7

Both SIRT5 and SIRT7 are lesser studied sirtuins. The former is only found in mitochondria where it acts as a global regulator of succinylation. Through its dessucinylation of superoxide dismutase (SOD1) it can lower the level of ROS produced by cancer cells. These ROS are thought to result form increased glycolysis, mitochondrial fermentation in defective mitochondria with poor oxidative phosphorylation. Found only in the nucleus, lysine deacetylase SIRT7 targets H3K18. The latter is found in the vicinity of multiple gene promoters involved in tumor suppression. Similar to the SIRT6, it attenuates engorged nucleoli containing ribosomes in a MYC-dependent manner by deacetylating MYC transcript targets of ribosomal proteins. SIRT7’s maintenance of H3K18 acetylation patterns appears important in keeping this morphological cancer phenotype. Enhanced rRNA production is such a conspicuous feature of cancer that it has been proposed as the 7th hallmark.

Returning to the idea of sirtuin localization being able to potentially explain opposing actions of sirtuins, SIRT7 is present and highly active in the ribosome-containing engorged nucleoli. This suggests its activity may promote rRNA synthesis and thus ribosome biogenesis. Finding a compound capable of inhibiting SIRT7 compound is of great interest. Nevertheless, STACS may be generally preferable to to sirtuin inhibitors for 3 reasons. Activators need not be as potent as inhibitors due to downstream signal amplification, they are more selective due to their ability to bind non-catalytic sites of target proteins, and their mimicry of natural activators is liable to induce fewer side-effects. Unfortunately, Kleszcz et al. make clear that until now (2015) “it has been a conundrum that such a diverse set of small molecules can activate SIRT1, but so far no activators of SIRT2-7 have been described”.

The sooner we learn to exploit endogenous sirtuin activation, improvements in cancer prevention as wellaas palliative and adjunctive cancer care may be attainable. Much of this may stem from appreciating  how dietary choices and sleep patterns, for instance, affect the expression of sirtuins. Diet is always front and center as a lifestyle factor and interestingly, multiple long-chain fatty acids have been shown to induce a 35-fold increase in SIRT6 activity at physiological concentrations. Furthermore, mice given nicotinamide riboside benefitted from increased insulin sensitivity, an effect that may stem from nicotinamide riboside’s ability to increase NAD+ levels, an endogenous sirtuin activator. This effect correlated with SIRT1 and SIRT3 upregulation.

Talking about ‘oncogenic activity’ makes more sense than talking about ‘oncogenes’

When cancer is viewed through the genetic paradigm, a parallel between the inconsistent tumorigenic effects of sirtuins and those of oncogenes emerges. A particular sirtuin might flip from being anti-tumorigenic to tumorigenic depending on the tissue type or grade of cancer. An oncogene can be both pro-tumorigenic and suppress tumors without a satisfying explanation as to why. Supporting this latter point is Soto and Sonneschein’s observation that “a mutation that should have produced uncontrolled cell proliferation resulted in cell death or arrest of cell proliferation. The significance of this parallel is that the opposing actions of both (onco)genes and sirtuins in the genesis and progression of cancer highlights cracks in the framework of SMT. For instance, genetic analyses of BRCA variants only explain about 10% of breast cancer susceptibility and amount to our best current predictions as of 2016. Fortunately, BRCA1’s known interaction with enzyme acetyl coenzyme A carboxylase alpha (ACCA) provides a clearer path for exploiting a metabolic vulnerability than purely genetic analyses of BRCA1 do.

The oncogenic paradox

SMT suffers from poor predictive power in terms of cancer occurrence and treatment outcomes. This led some to wonder how such a specific process (cancer) can stem from a number of unspecific mutation-inducing events (radiation, viruses, inflammation etc.). Albert Szent-Györgi termed the latter phenomenon the “oncogenic paradox. Fortunately, this paradox and oncogenic inconsistency can be stress-tested by exploring a prediction of SMT:

transferring transformed (cancerous) nuclei into non-transformed (normal) cytoplasm will induce tumorigenesis in the latter

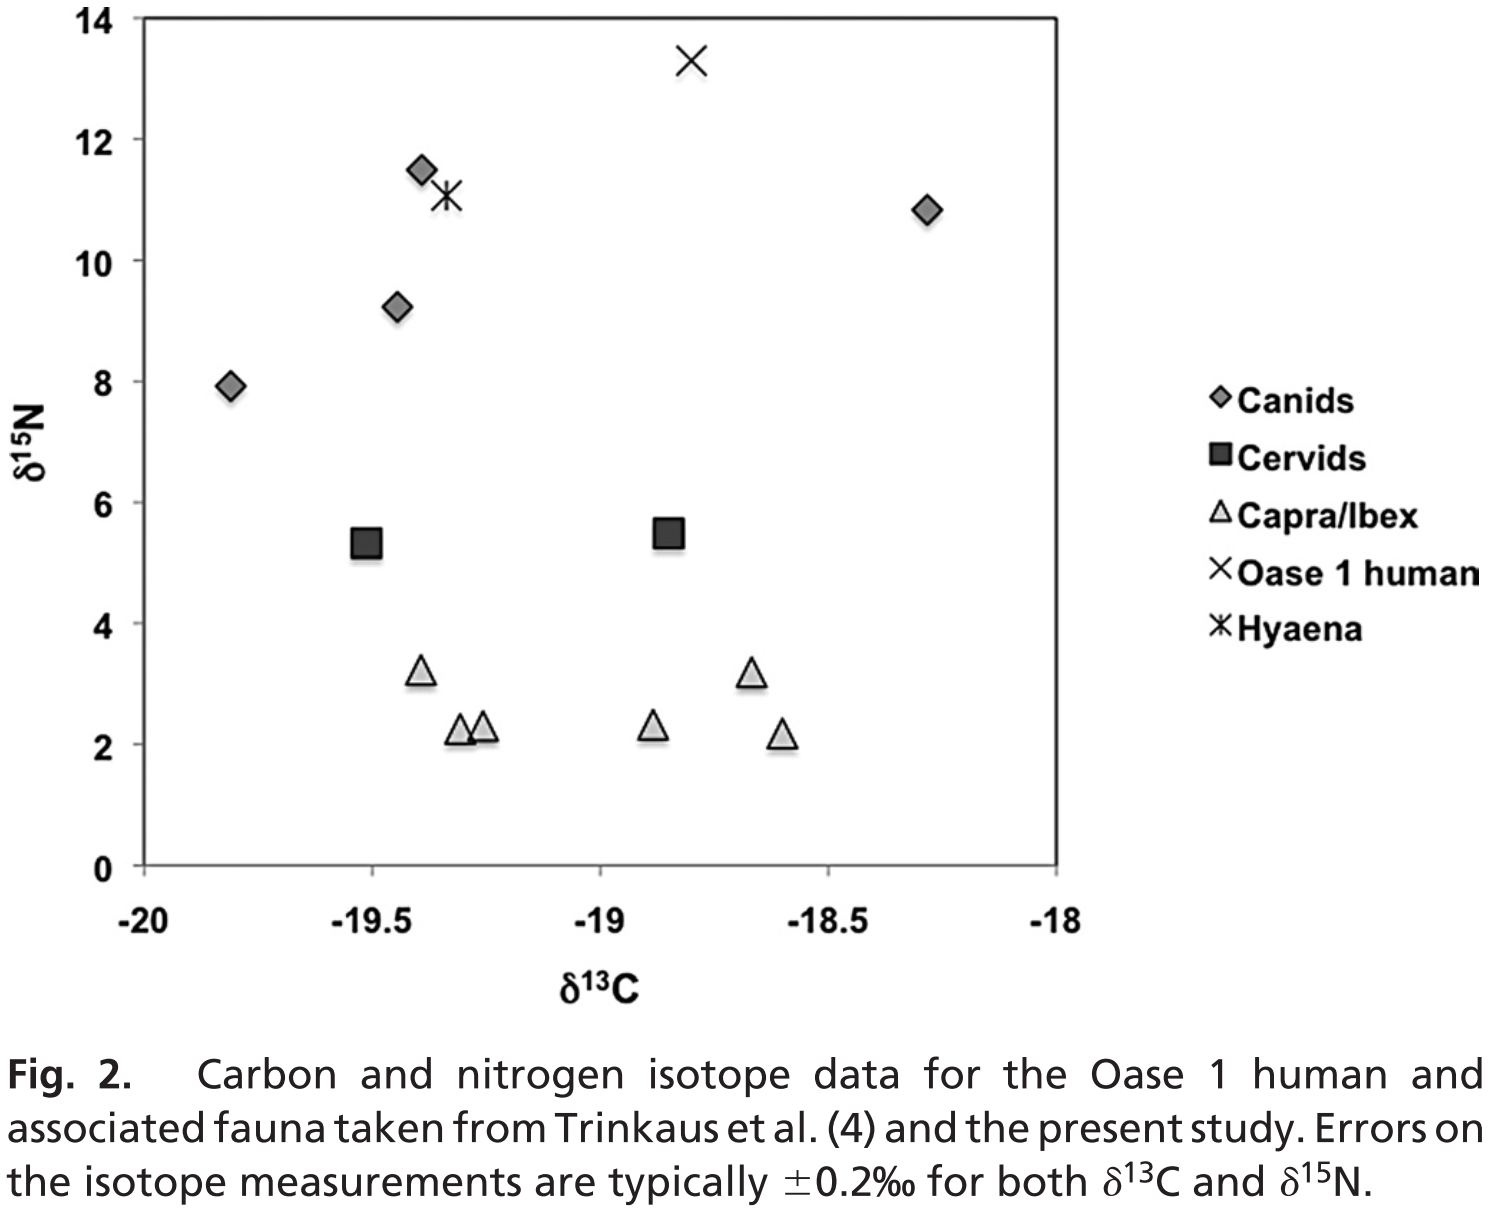
Such nuclear-cytoplasmic transfer experiments have been carried out. They show that nuclei from cancerous cells transferred into normal ones do not reliably transform the cell. The converse of that experiment should yield similar results, whereby cells with tumor nuclei should revert back to a normal non-cancerous state when cytoplasmic contents of normal cells, specifically their respiration competent mitochondria, are transferred to them. In 1988 Israel and Schaeffer showed exactly that. He used cytoplasmic hybrid, also known as cybrids, from preparations of rat liver epithelial cells. Both kind of transfer experiments are depicted in Figure 3 below.

transfer experiments

Figure 3. Nuclear/cytoplasm transfer experiments

Kulesa et al. demonstrated “the ability of adult human metastatic melanoma cells to respond to chick embryonic environmental cues, a subset of which may undergo a reprogramming of their metastatic phenotype. Thomas Seyfried of Boston College summarizes results from multiple nuclear-cytoplasmic experiments, saying “nuclei from cancer cells can be reprogrammed to form normal tissues when transplanted into normal cytoplasm despite the continued presence of the tumor-associated genomic defects in the cells of the derived tissues. This suggests that something in the cytoplasm, rather than something in the nucleus is driving tumorigenesis. It is this in addition to Warburg’s nearly century old observations of cancer cells displaying some degree of defective OxPhos, that begs the following question

how do gene regulatory elements link defective mitochondria and impaired respiration to highly unstable, disorganized and mutated nuclear genome?

Impaired respiration

ROS

One manifestation of impaired respiration is excessive reactive oxygen species (ROSs). The electron transport chain (ETC) in the inner mitochondrial membrane (IMM) uses electron carrying molecules to synthesize ATP and some of these electrons also (fully) reduce water. This imperfect process also partially reduces water, whereby electrons become unpaired in oxygen’s outer orbital and form multiple ROS compounds, such superoxide anions, hydrogen peroxides and hydroxyl radicals. Hydroxides (OH) for example may ‘steal’ electrons from membrane lipids and thus initiate a chain-reaction of neighboring lipids stealing electrons from one another. This changes the properties of membranes in an uncontrolled manner. ROS are physiologically unavoidable and participate in cell signaling. Yet because they are inherently damaging to cellular components they must be managed to avoid disease and accelerated ageing. Additional manifestations of impaired respiration include abnormalities in mtDNA, the proton motive gradient (ΔΨm) and the TCA cycle.

The Retrograde Response

Yeast and animal cells have ‘surveillance systems’ to react to these signs of impaired respiration. One of these signs is called the retrograde (RTG) response.  The RTP “responds to mitochondrial dysfunction by adapting cell metabolism to the loss of tricarboxylic acid (TCA) cycle activity. Thomas Seyfried correctly categorizes the RTG response as an epigenetic mechanism because it fulfills the criteria of specificity and memory: the basic helix-loop-helix-leucine zippers Rtg1/Rtg2 transcriptional factors complex demonstrate specificity when binding to the DNA R Box binding site for the transcription of a particular set of genes, as well as memory given that yeast maintains  those changes during cellular division when extending their lifespan. The RTG response is a signaling pathway relaying information about the organelle’s status to the nucleus. It’s response determines whether or not the major cell-quality control mechanisms of mitophagy and autophagy are induced.

The RTG response is a central mechanism underlying the MT of cancer because it links the hypothesized metabolic origin to the characteristic abnormally unstable and mutated nuclear genome. Essentially, the RTG response upregulates non-oxidative metabolic networks (or oncogenes from the gene-centric perspective) which shifts the cell’s energy yielding pathways to a predominant mix of glycolysis and glutamine fermentation so as to maintain ATP homeostasis (stable ΔG’ATP) despite insufficient respiration. Figure 4 below is Thomas Seyfried’s illustration (adapted from Michal Jazwinski’s work in yeast) of how the mammalian RTG response occurs.

RTG Response

Figure 4. RTG Response

Normally respiring cells have a dormant RTG response located in the cytoplasm. The RTG is actually a complex composed of Rtg1 dimerized to a strongly phosphorylated Rtg3. When a cell experiences defective or insufficient respiration, cytoplasmic Rtg2 partially dephosphorylates the Rtg1/Rtg3 complex, prompting both proteins to enter the nucleus so that Rtg3 may bind the R Box, followed by Rtg1 re-engaging Rtg3, effectively awakening the RTG response. This leads to the targeted transcription of multiple metabolic and antiapoptotic genes including CHOP, MYC, TOR, NF-𝜅B, Ras and CREB. This non-exhaustive set of genes has multiple associations with  cancer initiation, maintenance and metastasis. For one, MYC has been associated with increased levels of ROS and the inhibition of tumor suppressor p53. An example pertaining to metastatic behavior links the RTG response to increased levels of Matrix Metalloproteinase 2 (MMP2), as seen in activated macrophages hybridizing to neoplastic epithelia.

It is important to note that RTG response mediated destabilization of the nuclear genome, as well as the induction of aneuploidy and somatic mutations, all strong favor  the MT rather than SMT theory of cancer. Furthermore, the RTG response is also associated with multi-drug cancer resistant phenotypes, increased cytoplasmic calcium, increased ROS, iron-sulfur complex abnormalities, decreased mitochondrial ATP production as well as a lowered ΔΨm. Although there is no direct equivalent in higher eukaryotes of the yeast Rtg2 mitochondrial sensor transducing mitochondrial signals, authors Srinivasan et al. explain that “strong homologies between inhibitors and pathways of both [RTG genes and NF-κB] leads one to believe that the retrograde response is a potential predecessor of the now-central stress-regulator, NF-κB. In that same paper by Srinivasan et al., reproduced here in Figure 5, one can see the nearly identical RTG and NF-κB activity levels as they relate to 6 major metrics of cellular behavior.

RTG NF-kB

Figure 5. RTG vs NF-kB

Jazwinski also comments on the many similarities between yeast and human RTG responses, adding that “mammalian cells not only display many of the molecular features of yeast retrograde signaling, but they also present the cellular outcome of extended life span that characterizes the retrograde response. Lifespan extension mechanisms are inextricably tied to tumorigenic control ones. In figure 6 below Klement and Champ illustrate the mechanistic overlap between ketogenic diets (KDs), which can suppress tumors, and calorie restriction (CR), which has been shown to extend lifespan in multiple animal models.

cr kd

Figure 6. CR & a KD target the same molecular pathways

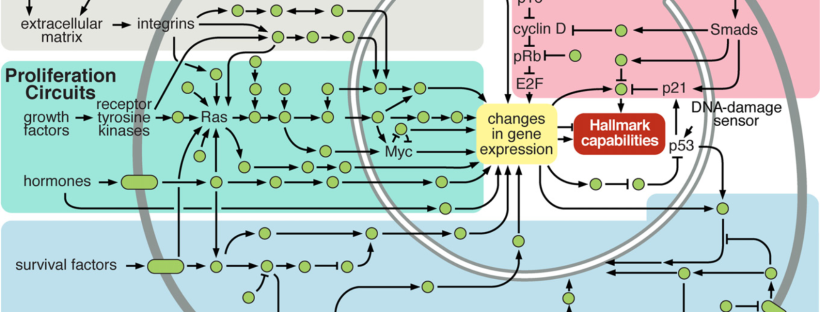
Figure 7 below illustrates the integrated circuits of a cell. What is interesting is that cellular circuitry is obviously drawn through the lens of the SMT. Pathways (arrows) leaving mitochondria towards ‘DNA Damage Sensors’ are nowhere to be seen. There seems to be little acknowledgement of how defective OxPhos leads to direct or indirect upregulation of glycolytic and fermentative networks. Rather, this shift in energy metabolism is deemed to originate from nuclear mutations.

Re-imagining Figure 7 through the MT lens, the RTG response would constitute a ‘Mitochondrial Damage Sensor’ with an arrow leading to NF-κB and integrating back into the web of arrows already present. Furthermore, there would be an increase in the proportion of arrows going from the mitochondria to the nuclear genome (and back), highlighting the metabolic origin as well as the bi-directional cross-talk enabling nuclear genomes to upregulate aforementioned metabolic networks. This is not a baseless hypothetical. For instance, the classic view of p53 as solely regulating tumorigenesis (and thus genomic stability) by inducing mitochondrial apoptosis or via transcriptional factor response elements must be updated, because it is now known to also regulate transcriptional target SCO2 (Synthesis of Cytochrome c Oxidase 2) through which mitochondrial energy production is influenced. Genomic stability, by way of p53, is thus highly dependent upon OxPhos status. Integrating this into Figure 7 once again, this would look like an arrow leaving the mitochondria to SCO2 and then on to p53.

cellular circuitry

Figure 7. Cellular Circuitry (as of 2000)

Returning to Jazwinski’s paper on the RTG response, another gene regulatory (not epigenetic) mechanism lending support to MT of cancer can be inferred from exploring how ceramide synthase activity found in the endoplasmic reticulum (ER) relates to mitochondrial dysfunction. The hydrolysis of sphingomyelin by sphingomyelinase (Smase) is a catalyzing reaction generating ceramide, a structural and signaling cellular component of mammalian cells. Ceramide appears to be stimulated by a variety of stressors such as TNF-α/matrix metalloproteinases/ROSs, cannabinoids and ionizing radiation. Ceramide is linked to retrograde signaling by way of it prompting Isc1 (Inositol phosphosphingolipase C), leading to autophagy. Jazwinski explains that “sphingosine and ceramide are precursors of complex sphingolipids [which] suggests that the balance in sphingolipid biosynthetic activity can tip the scale in autophagy from quality control to wholesale degradation and remodeling”.

Cannabinoids

In fact, phytocannabinoid THC ((−)-trans-Δ9-tetrahydrocannabinol) was shown to induce apoptosis in vitro. Authors explain this, saying the “first step in the apoptotic pathway was ceramide production, and that this led to loss of membrane potential, and caspase activation, respectively. Lesser known phytocannabinoid CBD (cannabidiol) was shown by McAllister et al. to reduce the aggressiveness of breast cancer cell proliferation, invasion, and metastasis by affecting mitochondrial ROS production in vitro. This CBD-mediated effect appears to occur down 2 pathways: ERK (extracellular signal-regulated kinase) activation and increasing ROSs further. Both of these pathways can decrease Id-1 (Inhibitor of DNA Binding 1) gene expression, leading to reduced cell proliferation and invasion. The way in which these cannabinoids seem to work adds to the evidence supporting a theory of cancer based in metabolism. One way these cannabinoids exert effects on metabolism involves ceramide, as “ceramide generated upon CB1 cannabinoid receptor activation may enhance ketone body production by [rat] astrocytes independently of MAPK.

Cannabinoids to ketone bodies

Interestingly, this line of investigation leads to promising in vitro and in vivo experiments highlighting the emerging role of ketone bodies as alluring metabolic fuels. They appear capable of simultaneously stressing cancer cells and supporting normal ones. The link between the MT of cancer and gene regulatory effects of ketones are apparent when considering some of the properties of endogenously produced ones, such as d-β-hydroxybutyrate (βOHB) (chemically not a ketone but a carboxylic acid). βOHB specifically inhibits class I HDACs. This βOHB-induced HDAC action “correlated with global changes in transcription, including that of the genes encoding oxidative stress resistance factors FOXO3A and MT2 […] consistent with increased FOXO3A and MT2 activity, treatment of mice with βOHB conferred substantial protection against oxidative stress. The shared mechanisms via which both cannabinoids and ketones place metabolic stress on cancer cells whilst protecting normal ones strongly support a MT of cancer.

Conclusion

In conclusion, it is worth pausing for a moment and reflecting on the fact that ketones and cannabinoids, 2 highly non-toxic compounds endogenous to humans, have been unfairly maligned. The former because of its conflation with diabetic ketoacidosis and the latter because of harms associated with drug abuse. Yet, both are now resurfacing in medical research as highly promising compounds, especially for treating the emperor of all maladies, cancer.

It is also worth pondering how the range of new cancer therapies like HBOT (hyperbaric oxygen therapy), ketogenic diets and deuterium (2H) depleted water (DDW) share overlapping mechanisms directly impacting metabolism by influencing mitochondrial status – especially OxPhos activity. The latter therapy, DDW, delayed prostate cancer progression in a 4-month phase 2 clinical trial that was double-blind and randomized. The mechanism of action of DDW as explained by Boros et al. de facto serves as further evidence of a metabolic origin of cancer:

The excessive appearance, i.e. accumulation of ‘‘metabolically dry” oncometabolites [such as 2-HG] is consistent with our hypothesis that cancer is formed on the basis of mitochondrial defects that lack hydration of TCA cycle intermediates with low deuterium matrix water as the result of such defects. Such claim is supported by the fact that restoring hydratase function of mitochondria reverses tumor cells back to their genetically stable non-proliferating normal phenotype [37] with normal matrix water content, composition and morphology

It is time for SMT-centric mainstream cancer researchers to reconsider the fundamental mechanisms of action of the few marginally successful gene-based therapies on the market. Rather than viewing genetic, epigenetic and gene regulatory phenomena as epicentres of action of ‘gene-based therapies’, these might actually be downstream of metabolic disturbances. This is a major distinction in how one thinks cancer is caused.


Thoughts on Cancer

Edit (26/01/2016)

The problem of cancer is not to explain life, but to discover the differences between cancer cells and normal growing cells. Fortunately this can be done without knowing what life really is. Imagine two engines, the one being driven by complete and the other by incomplete combustion of coal. A man who knows nothing at all about engines, their structure, and their purpose, may discover the difference. He may, for example, smell it.” – Otto Warburg 1956

If one could only learn about human health studying a single disease, I would pick cancer hands down. Its study boils down to askying why and how some cells either live or die. The distilled question is simple, yet cancer is everything but. It forces us to confront its behavior which is easily anthropomorphized: why are these cancer cells malcontent with simply being alive? What is this insatiable need for invading other body parts? Stranger yet, cancer is synonymous with death even though it is part and parcel with biological life – even trees get cancer or at least they also manifest uncontrolled cell growth. Stringent definitions are hard and tedious to establish but they really matter, so for the sake of clarity lets use the Hallmarks of Cancer. It embodies the 6 behavioral traits characterizing the disease:

  • Evading death
  • Ignoring anti-growth signals
  • Self-directing growth
  • Literally being blood-thirsty
  • Invading other tissues
  • Unlimited replication

The currently accepted Somatic Mutation Theory of cancer (SMT) is based in genetics. Basically, it asserts that a single cell suffering 1 or more random mutations conferring it with a growth advantage deleterious to its host, can cause cancer. In other words “it is a disease in which an individual mutant clone of cells begins by prospering at the expense of its neighbors” (Molecular Biology of The Cell, 6th Edition, page 1091). Progress towards cures for this still enigmatic disease has been thoroughly underwhelming. In my view, this is mostly because mainstream cancer researchers place too much confidence in SMT. To be fair, cancer cells are 1 big tangle of mutations. But they are not just that. They are also deformed (abnormal morphology). Maybe most importantly, how they make their energy changes. More specifically, their respiration is damaged. Or maybe not – and this is where the bone of contention lies. Some SMT proponents will argue that respiration is not actually broken, that it is just not used as much nor necessarily for the same purpose. Others, that it does not matter either way. The Metabolic Theory of cancer (MT) argues that the functional state of respiration in a cell really matters because broken respiration can cause cancer. The mutations seen in cancers thus result from, rather than cause, damaged respiration. MT is thus based in metabolism rather than genetics. MT proponents say that all cancer cells are characterized by faulty energy production systems. Theys can no longer produce their share of energy (ATP) by respiring and that respiratory function is substantially decoupled from ATP production. By analogy, the cell is stomping on both the accelerator and clutch simultaneously. This is not good for cars or cells. MT argues that such respiratory dysfunction instantiates changes (many of which are genetic) leading to the 6 behavioral traits somehow exhibited by the disease.

Mainstream research has primarily dimissed MT because of 2 observations. 1) A normal cell can be reliably turned cancerous upon suffering certain mutations. This is undeniable. Consequently MT proponents argue that such mutations leads to cancer to the extent that they interfere with normal respiration. 2) Not all cancer cells have a broken respiration system. This is disputed. MT proponents say respiration only appears functional because the cell is in fact ‘pseudo-respiring’. Pseudo-respiration is the generation ATP using the mitochondria’s respiratory apparatus for fermentation, but without consuming oxygen. Mitochondrial fermenatation involves a process called substrate-level phosphorylation.

Given that the first observation supporting SMT over MT suffers from a pesky alternative causal explanation and the accuracy of the second one is disputed, a good clarifying question to pose at this is point is whether it is easier to identify a cancer cell based on its profile of mutations or on the integrity of its respiratory apparatus? I would venture the latter. Consider the thousands of mutated genes strongly associated with cancer (oncogenes) that, when woven together into clinical interventions duly fail to save lives by and large. At this juncture it would be sound to question the entire conceptual premise upon which these interventions were conceived. Instead we do what so many health gurus excel at: polishing turds. We dress up our failure as success and give it a sexy name, ’personalized cancer genomics’. Tilt your head to the left and it is the most exciting, cutting-edge approach that is truly tailored to the special snow-flakes that we all are. Tilt your head to the right and it is an implicit admission that our interventions do not work to any significant extent  on a population level because the SMT underpinning them is plain wrong. Similarly, the notion that cancer is not just 1 disease but many different ones may stem from the same reluctance of recognizing failure. See the fascinating success story of treating Chronic Myeloid Leukemia (CML) with Imatinib (Gleevec). It is all the more interesting given how plausible MT-derived alternative explanations are.

There are many finer theoretical and experimental points that can and should be debated. However, the final point I wish to make is somewhat different. Consider the phenomenon of Epithelial to Mesenchymal Transition (EMT) which proposes a mechanism for metastases within the SMT framework: clonal selection (natural selection) acts upon a series of genomic alterations (mutations) such that a cell acquires invasive (metastatic) behavior. Simple, right? Not quite. Especially not when considering what metastases actually involve. Thomas Seyfried explains this best (bold highlights & numbering are my additions):

“It is difficult to understand how a collection of gene mutations, many of which are random, could produce cells with the capacity to [1] detach from the primary tumor, [2] intravasate into the circulation and lymphatic systems, [3] evade immune attack, [4] extravasate at distant capillary beds, and [5] recapitulate epithelial characteristics following invasion and proliferation in distant organs. This would be quite a feat for a cell with a disorganized genome.” (Metabolic Theory of Cancer, Chapter 13.2.1)

Yes, cancer cells are very clever but their genomes are also very messy. They are successful but not happy. Ultimately the ‘mutations all the way down’ explanation for their malicious behavior is unsatisfying. A better although incomplete explanation is tentatively available: damaged respiration usually forces a cell to (1) repair itself or (2) commit suicide. Things go awry when it ignores options 1 and 2. It is in the adaptation to (3) staying alive without proper repairs that cancer emerges. Adapting to alternative methods of energy production due to damaged respiration forces a cell to survive through different means. These different surival strategies call for a lot of glucose, glutamine, always more vasculature and tissues capable of sustaining the engendered momentum. Does MT do a better job of explaining the seemingly calculated behavior of metastases? Somewhat. The ‘energy seeking tumor’ explanation is more plausible in my mind than the one of ‘random mutations conferring super-powers’.

Regardless, cancer is a bitch.

The Thrifty Genotype/Phenotype Hypothesis is wrong

In 1962 James Neel proposes the Thrifty Genotype hypothesis and then the Thrifty Phenotype hypothesis as an addendum of sorts to the original theory. A thrifty gene uses resources carefully. It does not waste them, so the idea goes, because its predecessors dealt with famine by conserving energy. A thrifty phenotype however develops because of pre-natal (intrauterine) famine conditions which signal energy conservation. Given that modernity doles out virtually famineless environments, there is a consequent mismatch with this thrifty character trait. A life-saving adaptation comes back to bite us in the ass; diseases of civilization such as diabetes and obesity ensue. The simplicity of the mismatch hypothesis (an outgrowth of Darwin’s theory of natural seclection) lends undue credence to the Thrifty Gene and Thrifty Phenotype hypotheses, making them alluring, even palatable. Both are perfectly reasonable hypotheses but are wrong.

The hypothesis stumbles when its foundational assumption is challenged. The assumption is that Paleolithic humans feasted and were frugal with those calories to pre-empt recurring famines. The burden of proof clearly lies with proponents of this claim. Accordingly, Allen and Cheer say that “this is far from generally accepted. Nevertheless, the burden is not typically shouldered, most likely because of how entrenched Hobbes’ solitary, poor, nasty, brutish and short description of pre-agricultural societies has become. So what evidence is there for these recurring Paleolithic famines? Not much aside from flimsy extrapolations derived from observing modern hunter-gatherers struggling to feed themselves within dwindling hunting areas losing flora and fauna. There is strong evidence of famines reliably threatening humans once agriculture took off. Do we entertain such assumptions for other species? Not without pertinent climate or archeological evidence. Evidence suggestive of recurring famines seems entirely lacking for pre-Neolithic humans. Many find it hard to accept that the same innovation (farming) responsible for population explosions (putative progress) also regularly incurs famines (an obvious negative). Too bad.

The thrifty phenotype purports to stem from an increased propensity to store energy. It is only logical to consider how insulin dynamics may participate in this. Non-insulin dependent glucose uptake aside, the less insulin you need to get glucose into a cell, the more insulin sensitive you are. The more insulin sensitive you are, the more thrifty your genotype/phenotype, since you require less (insulin) to store a given amount of calories. Thriftiness is maintained in a famine not by being insulin sensitive but by being more insulin resistant. Specifically, you become more peripherally insulin resistant, prioritizing glucose shunting to your brain which cannot do without it. In other words, more of the limited available energy is used for essential functions (thriftiness). This insulin resistance is not pathological, unlike hyperinsulinemia-associated insulin resistance characterizing metabolic syndrome. Rather, the innate capacity to move along either extremes of the insulin sensitivity spectrum is central to how varying energy availability is handled. This thrifty hypothesis is problematic because it pathologizes a normal adaptation.

Watve and Yajnik raise 5 principle objections to the Thrifty genotype/phenotype hypothesis worth considering:

  1. Neel’s arrow of causality indicates that insulin resistance begets obesity. Watve and Yajnik argue obesity begets insulin resistance by pointing out how insulin sensitive Pima Indians are more likely to be overweight.

Point 1 is still an open question. Just as there are different ways one can suffer an infection, it is plausible that obesity could result from insulin resistance in some and in others engender it. However, obesity is most strongly correlated with insulin resistance. This correlation likely strengthens upon adopting more stringent measures of insulin resistance like Kraft’s criteria.

  1. Neel argues lower birth rates would give rise to thrifty phenotypes but this relationship does not bear out empirically.

Point 2 indicates a correlation between diabetes risk factors (as measured by a 2 hour OGTT with insulin assay) and low birth weights. This correlation is robust. The tissue of these infants born underweight is predicted to have a lower resting metabolic rate, reflecting a thrifty phenotype. However, authors Eriksson et al. found that “the muscle tissue of people who had a lower birth weight is more metabolically active than those with a higher birth weight. Yet another correlation bites the dust in the wake of prediction testing.

  1. Food is intermittently available throughout the year in colder climates, predisposing inhabitants to insulin resistance in order to cope with periods of low-food availability. Contradicting this prediction is the observation that ethnic groups inhabiting more northern latitudes do not appear more insulin resistant than their equatorial counterparts.

The prediction in point 3 is that people in colder climate are more insulin resistant and thus more likely to become obese (or diabetic). This correlation does not bear out. Many counter observations  are available.

  1. Obesity might be more of a neurobehavioral disorder than a metabolic one according to O’Rahilly and Farooqi. This is not a convincing argument in and of itself (for many reasons) and is best summed up as ‘moving the goal posts’.

Point 4 is a weak attempt by Watve and Yajnik to argue against an insulinocentric theory of obesity by invoking leptin as the center piece of a neuro-hormonal approach. By now it is clear to anyone paying attention that obesity cannot be explained by insulin dynamics alone. Yes, we should attempt to understand how our brain integrates insulin and leptin signaling into behavioral outputs. Re-branding the problem as neurohormonal does nothing to advance that.

  1. The Thrifty hypothesis does not attempt to account for insulin signaling aspects including but not limited to longevity, reproduction and immunity.

Point 5 argues non-metabolic aspects of insulin are ignored by Neel’s theory. This is correct. However the point is somewhat facile given how much has been learned about insulin since the theory’s inception.

The cure for a disease is not necessarily the reciprocal of its cause. Keeping this in mind, the thriftiness-insulin axis of obesity is seriously dented by Christopher Gardner’s recent study randomizing insulin sensitive and insulin resistant subjects to a low-fat (~57% carbs) or low-carb (~18% carbs) diet. It failed to detect “a significant interaction between diet assignment and IR-IS status.

The Thrifty hypothesis is doomed to fail considering it does not account for the insulin sensitivity of different tissues. In a similar vein, it also fails to distinguish between pathological and adaptive insulin resistance. Finally, Allen and Cheer nicely summarize how this hypothesis falls prey to taking metaphorical reasoning too far, saying <<Mcgarvey states that the wide acceptance of the concept illustrates the generative role of metaphorical thinking in bioanthropology. Whether the concept is correct or not (in the narrow sense), it “allows for the generation of concrete studies of metabolic processes and their fertility, mortality and morbidity concomitants”>>.

Rebuttal of 14 claims about metabolism, genetics, paleoanthropology & stable isotope analyses in Hardy et al.’s 2015 paper “The Importance of Dietary Carbohydrate in Human Evolution”

Abstract

The evolutionary selective pressures which drove human encephalization are passionately debated, largely because the brain’s function accounts for much of our ill-defined and ever-changing ‘human uniqueness’. Apportioning individual contributions from the multitude of factors ranging from climate change to food and socialization dynamics requires a truly multidisplinary approach encompassing evolutionary biology, genetics, medicine, archeology, chemistry, physics, climatology and many more scientific fields. It is with this wider perspective that evidence for how food contributed to human encephalization is assessed. Clues from human metabolism, anatomy and food web positioning in addition to stable isotope analyses do not generally support the hypothesis that cooked starches were a major driver of human encephalization. Land and marine life as wells as birds and insects seem to have contributed substantially more to it. 11 points on metabolism, 1 on genetics, 1 on paleoanthropology and 1 on stable isotope analyses are individually rebutted.

In their paper, The importance of dietary carbohydrate in human evolution, Hardy, Brand-Miller, Brown, Thomas and Copeland argue for the importance of dietary carbohydrate (mainly in the form of cooked starches) in human evolution and particularly encephalization. One way they do this is by drawing an association between the supposed advent of controlled fire use (cooking) by hominims with increases in AMY1 copy numbers. Neither the timeline for the emergence of cooking or the AMY1 copy number increase are supported by their citations or by more recent evidence discrediting this purported association. Much of their argument is thus based on genetics, paleoanthropology and both general and specific claims of human metabolism as well as stable isotope anlayses, all of which can be individually rebutted.

Stable istope analysis

Hardy et al. severely misquote a 2009 paper by Richards and Trinkauss – in which stable isotope analyses of Oase 1 humans and Neanderthals were performed – because it is used to support the notion that human diets likely included substantial amounts of starch given the variations in  δ15N and δ13C ratios.

[1]“a wider range of isotopic values have been observed in contemporary Middle Pleistocene H. sapiens (Richards and Trinkaus 2009), indicating that considerable differences in the levels of starch consumption existed between these two species”

The 2009 paper by Richards & Trinkauss actually found that “early modern humans (~40,000 to ~27,000 cal BP) exhibited a wider range of isotopic values, and a number of individuals had evidence for the consumption of aquatic (marine and freshwater) resources […] The other early modern humans all have δ13C values < –18.5‰ (see Fig. 1 and Table S2), which indicate that their protein came from terrestrial C3 (or freshwater) foods, yet many of them have high δ15N values, at or above the highest Neanderthal values”. It is unequivocal that the δ15N and δ13C variations refer to the dietary apportioning of land versus marine protein, not to the ratio of dietary carbohydrate versus fat. In fact, the authors clearly state that “The Oase I δ15N value is also above those of the hyena (11.1‰), and the highest wolf value (11.5‰) from the same site and dating to about the same time”. This also unequivocally contradicts the notion that starches were a significant dietary contributor for these hominins given that this evidence suggests that they were more carnivorous than Neanderthals, hyenas and wolves as evidenced by their Figure 2 represented here.

Isotope Analysis of Oase 1 humans & Neanderthals vs other animals

Genetics

Hardy et al. cite 2 papers to substantiate the claim that the copy number increase of AMY1 occured less than 1 million years ago despite neither paper supporting it.

[2]“it [multiplication of the AMY1 genes] is thought to be less than 1 million years ago (Samuelson et al. 1996; Lazaridis et al. 2014)”

  • The first paper from 1996 by Samuelson et al. gives no specific date concerning the emergence of AMY1 copy number increase since it was not the objective; their objective was to “infer the structures of common ancestors and trace the evolution of the modem human amylase promoters”. The second is a 2014 paper by Lazaridis et al. which also does not mention a date for AMY1 copy number increase since it is focused on issues of lineage by studying 7-8kya Neolithic skeletons from La Braña (Spain), Motala (Sweden) & Loschbour (Germany). Only once does Lazaradis et al. briefly reference a hypothesized association between AMY1 copy number increase and high starch diets by citing Perry et al. 2007. Interestingly, the latter reference contradicts Hardy et al.’s purported timeline for AMY1 gene copies increase as, in their words, it was mosty likely of “a relatively recent origin that may be within the timeframe of modern human origins (i.e., within the last ∼200,000 years”.
  • Irrespective of when the when copy numbers of AMY1 increased, the significance of this is still unclear. It has been hypothesized that more copies of the AMY genes would improve glucose homeostasis on higher starch diets and protect against obesity (1, 2, 3). Nevertheless, Nature Genetics in June 2015 published a study by Usher et al. where the authors did “not observe even a nominal association between obesity and the copy number of any amylase gene (P = 0.70 for AMY1)” nor did they in diabetic cohorts where “AMY1 copy number did not associate with BMI in any group (P = 0.31 for GoT2D controls, P = 0.24 for GoT2D cases and P = 0.53 for InCHIANTI samples)”. Usher et al. explain why previous studies may have found associations that were not there given the use of ”lower-precision molecular methods, such as RT-PCR and array comparative genomic hybridization (CGH), or lower-precision analyses of whole-genome sequencing data to measure copy number”. It would be prudent to first understand the significance of the AMY genes in humans before using them as a mechanistic foundation in arguments relating to the evolution of humans and their encephalization.
  • In June 2015 Perry et al. avoided using “lower-precision molecular methods […] to measure copy number”, unlike Carpenter et al.’s group in March of that same year. This improved copy number assessment enabled Perry et al. to confidently conclude that “AMY1 gene duplications are likely human-specific and that they occurred following the divergence of our lineage from the Neandertal/Denisovan lineage ~550-590 kya”, contradicting Hardy et al.’s less than 1 million years ago timeline.

Paleoanthropology

Hardy et al. correctly cite the only paper to date supporting their view of hominim cooking emerging less than 800kya. However, the natural event confounding the interpretation provided by this paper and more recent evidence to the contrary are not mentioned as a counterbalance. Furthermore, Hardy et al. do not provide the reader with a representative view of the balance of evidence which currently is heavily biased towards the hypothesis of fire emerging 400-300kya.

[3]”Gesher Benot Ya’aqov, in Israel, which dates to around 780,000 bp, has charcoal, plant remains, and burned microartifacts in concentrations that the excavators believe suggests evidence for hearths (Alperson-Afil 2008)”

  • A 2008 paper by Alperson-Afil is cited as evidence of when hominin cooking emerged 780kya as evidenced by the Gesher Benot Ya’aqov (GBY) site in Israel. It does in fact conclude that “as the scenario of a natural fire is unlikely, we conclude that the concentrations of burned flint microartifacts in the different occupational surfaces of GBY represent phantom hearths, i.e. remnants of hominins’ use of fire”.
  • This conclusion is probelmatic for 2 major reasons. The first is addressed by Shimelmitz et al. in 2014, where it is explained that “consistent evidence for fire is found not just in the Tabun sequence but at every Acheulo-Yabrudian cave site where good information is available. The near-absence of burnt flints in the lower 8m of the sequence at Tabun (composed of 19 layers) also indicates that the scarcity of fire evidence before 350 kya is not just a matter of spotty preservation, or cave sites versus open air-sites (e.g., Gowlett and Wrangham, 2013). Rather, the negative evidence from the early layers is genuine, and there is a significant and permanent increase in the frequency of evidence for burning between 357 and 324 kya […] our best estimate for the onset of regular fire use at Tabun is between 357 and 324 kya”.
  • The second problem is that lava probably invaded the GBY site, as correlated with the Matuyama-Brunhes chron boundary event taking place 781kya. This occurence further substantially confounds Alperson-Afil’s interpretation. Evidence for this event at GBY stems from “artefacts in fluvial conglomerates, organic-rich calcareous muds and coquinas that accumulated along the shorelines of the palaeo-Hula lake (Goren-Ibar et al. 2000)”.

Metabolism

A lot of Hardy et al.’s argument for the important role of dietary carbohydrate in human evolution and the spectacular encephalization is based upon claims about metabolism. These 11 points are at best taken out of context or at worse entirely false.

[4]“There is debate on whether dietary carbohydrates are actually essential for human nutrition”

  • Micronutrients and macronutrients have been defined as essential when their absence causes a deficiency syndrome. No such ‘carbohydrate deficiency’ has been found to date and, to the best of my knowledge, nor has any suggestive evidence surfaced in the last century.
  • The 1999 report by the IDECG Working Group, led by DM Bier, recognizes that “the theoretical minimal level of carbohydrate (CHO) intake is zero”, before following on about its importance in human biological function.
  • Glucose is essential for cells to function but it does not have to originate from dietary sources due to an evolved gluconeogenetic capacity capable of providing 150 grams per day for CNS functions. This lack of reliance on dietary glycose has been validated since at least 1975 by Cahill and Owen’s 2 month starvation experiment. Depicted in their Figure 1, they found that the human brain always requires at least 35% of its energy from glucose (not necessarily of dietary origin).brain usage of glucose & ketones
  • In 1972 Drenick et al. stress-tested human reliance on endogenous glucose showing that “after fasting 2 months, administration of weight-adjusted doses of insulin […] no insulin reactions nor significant rises in catecholamine excretion occurred despite equal extent and rate of glucose fall. Glucose concentrations as low as 0.5 mmoles/liter (9 mg/100 ml) failed to precipitate hypoglycemic reactions.”
  • When dietary carbohydrates are avoided entirely and protein is moderated the human brain will use ketone bodies as its primary energy substrate. In such a metabolic state, Vanitalie and Nufert say that “although these data need confirmation, they suggest an increase in the metabolic efficiency in human brains using ketoacids as their principal energy source in place of glucose”.

[5]“a more realistic recommendation is that at least one-third of dietary energy should be supplied from carbohydrates (Bier et al. 1999)”

  • For this Hardy et al. quote, the 1999 report by the IDECG Working Group, led by DM Bier, does not identify a carbohydrate deficiency syndrome but advises at least 150g per day for “practical reasons”.
  • Dr.Eric Westman summarizes his findings about carbohydrates being non-essential saying “although there is certainly no evidence from which to conclude that extreme restriction of dietary carbohydrate is harmless, I was surprised to find that there is similarly little evidence to conclude that extreme restriction of carbohydrate is harmful.”

[6]“Glucose is the only energy source for sustaining running speeds above 70% of maximal oxygen consumption (Romijn et al. 1993)”

  • Brook et al., who developed the Cross-Over Point hypothesis, did not state that glucose was the only energy source above 70% VO2 max, only that it and glycogen were the main sources and free fatty acids the minor source. Hardy et al. essentially describe a binary change in energy substrate use when in fact the change is quantitative.
  • It is an unproven assumption that carbohydrates of dietary origin are necessary to use glycogen and glucose as the predominant substrate for instances of near maximal VO2. Even if it were true that glucose use always predominates across all individuals at >70% VO2 max, this does not automatically imply that dietary glucose is the necessary fuelling strategy for sustaining such intense efforts. These are separate claims.
  • In 2015 Hetlelid et al. showed that well-trained runners performing high intensity training at 85% VO2 max, nearly one third of the total energy expenditure comes from fat oxidation. Furthermore, the lower intensity, steady state equations of indirect calorimetry used here and elsewhere overestimate carbohydrate oxidation and underestimate fat oxidation.
  • In 2014 Noakes, Volek and Phinney characterize this quantitative change in energy substrates according to effort intensity, saying “some highly adapted runners consuming less than 10% of energy from carbohydrate are able to oxidise fat at greater than 1.5 g/min during progressive intensity exercise and consistently sustain rates of fat oxidation exceeding 1.2 g/min during exercise at ∼65% VO2max, thereby providing 56 kJ/min during prolonged exercise. The remaining energy would comfortably be covered by the oxidation of blood lactate, ketone bodies and glucose derived from gluconeogenesis”
  • Preliminary results from Volek et al.’s soon to be published FASTER study (Fat Adaptated Substrate Oxidation in Trained Elite Runners) have been reported at www.ultrarunning.com. Maximal fat oxidation rates higher above 1.54g per minute with 1 subject reaching 1.8g were shown. Classic sports physiology literature performed in non-ketogenic dieters with sub-optimal fatty acid oxidation capacities previously found maximal fat oxidation rates of only 1g min. These findings will, quite literally, require re-writing text books.
  • Elite ultra-runner and FASTER study participant Zach Bitter shared his personal data. At 75% VO2 max he used 98% fat and 2% carbohydrate. At 84% VO2 max he used 76% fat and 24% carbohydrate. Finally, at 96% VO2 max he was still using 23% fat and 77% carbohydrate.

[7]“In an evolutionary context, large stores of glycogen must be generated in order to provide sources of glucose for periods of sustained fasting or hardship. To build these reserves, the diet must consistently provide energy surplus to basal metabolic requirements”

  • The human gluconeogenetic capacity mentioned above disqualifies this imperative statement. Red blood cells, immune cells and the brain, as well as the more extended CNS, all function properly with glucose solely of endogenous origin.
  • The average lean male has tens of thousands of stored calories available to him in adipose tissue in contrast to his glycogen storage capacity of approximately 15 g/kg. Furthermore, his adipose tissue contains all the glycerol precursors required for endogenous production of glucose when combined with amino acids.

[8]“The diets of traditional Arctic populations are sometimes given as examples of successful high-protein diets (Lindeberg 2009)”

  • It is a common mistake to assume that the Inuit ate high-protein diets or it may simply be a misnomer arising from its association with the consumption of animal protein. In humans, high-protein diets lead to protein poisoning, otherwise known as ‘rabbit starvation’ (4, 5). The protein ceiling is 35-40% of calories or 200-300g of protein a day. The Inuit ate high-fat diets and their protein intake was moderate. Unlike the livers and kidneys of lions or wolves, human livers have substantially lower functional hepatic nitrogen clearances (FHNC) and urea nitrogen synthesis rates (UNSR) (6, 7).

[9]“15–20% from carbohydrate principally in the form of glycogen from the meat they consume (Ho et al. 1972)”

[10] “Meat frozen soon after slaughter will retain much of its muscle glycogen (Varmin and Sutherland 1995)”

  • Points 9 and 10 can be addressed together. The citation for point 7 should be “Varnam and Sutherland 1995”.
  • Greenberg et al. recognize the Inuit diet as one of “80–85% fat, 15–20% protein, and, apart from a little muscle glycogen, almost no carbohydrate” by citing Phinney’s 2004 paper.
  • Ho et al.’s 1972 study conduced in Point hope, Alaska, does not provide evidence of how this estimate is arrived except that it is based off of a 3,000-4,500kcal diet. Presumably, the reported glycogen levels are those of live animals.
  • Raw meat from a dead seal contains 0 grams of carbohydrate. In fact, in 1995 Varnam and Sutherland themselves explain that “if meat is frozen before ATP and glycogen levels are depleted post-mortem glycolysis is suspended. On thawing, however, the meat undergoes severe contraction with associated toughening and loss of large quantities of drip (thaw rigor)”. Simply stated “in response glycogen, the main energy store in the muscle, is converted to lactic acid by anaerobic, post-mortem glycolysis”. Momentarily and drastically slowing post-mortem glycolysis by flash-freezing meat will not stop glycolysis from depleting glycogen when the meat is finally thawed for consumption. The resulting lacate is a glucose element but is not counted into the percentage of dietary carbohydrate in a diet.
  • Flash-frozen meat does not contain glycogen levels anywhere near those necessary to support Hardey et al.’s statement. In 1976 Hamm explains how “the regulatory enzymes which control ATP metabolism and glycolysis in the living tissue are still active in the muscle postmortem, but these enzymic mechanisms are not able to maintain the ante-mortem levels of ATP and glycogen because the oxygen supply of the cell is stopped as soon as the blood circulation is interrupted by death of the animal. The lack of the aerobic ATP synthesis from ADP in the muscle mitochondria results in an anaerobic depletion of glycogen and consequently in a disappearance of ATP within a few hours p.m.”
  • In 1936 Sharp related glycogen’s conversion to lactic acid over time as a function of temperature (°C) saying that “in fish-muscle in the frozen state the maximum rate of glycogenolysis occurs in the interval -3.2° to -3.7 [and] freezing at -2° and lower temperatures for a period of 4 hours causes injury to the muscle, resulting in very rapid lactic acid formation on thawing. Freezing at 1.6° has no such effect, and on thawing the normal rate of lactic acid formation is resumed.” Figure 2 and 3 from his paper graphically illustrate this relationship.Lactic acid & glycogen in frozen muscle

[11]“the derived A-allele [CPT1A gene] has been shown to associate associate with hypoketotic hypoglycemia and high infant mortality […] suggests that it is an important adaptation to high meat, low- carbohydrate diets”

  • The association between hypoketotic hypoglycemia and high infant mortality with the CPT1A allele is from Clemente et al.’s 2014 paper which references a 2009 paper by Greenberg et al. entitled “The paradox of the carnitine palmitoyltransferase type Ia P479L variant in Canadian Aboriginal populations” in which 3 familes for a total of 7 patients were studied. The conclusion was that “severe clinical effects have been observed in only some, but not all, infants and young children [and] the occurrence of hypoglycemia, the main initial clinical effect of CPT-I deficiency, is dependent upon many environmental factors, including infection, feeding history and long-chain fat content of the diet, glycogen stores in the liver, and perhaps even climate“.
  • Clemente et al. found “strong evidence in favor of selection from a de novo mutation P(SDN) = 0.98, as opposed to selection on standing variation”. In simple terms, this means it was strongly positively selected for in high latitude populations eating very high-fat diets. Clemente et al. characterize these CPT1A mutations as “strong deviations from mutation-drift equilibrium”. Interestingly, Greenberg et al. describe the CPT1A mutations as ‘a paradox’ whilst Clemente et al. as ‘deleterious’. Patient 2 in the study of the former, for example, was most likely on a Westernized, relatively high carbohydrate diet described as a “regular diet and skim milk”. Such a diet underpins many ‘diseases of civilization’ and most likely contributed to the hypoketotic hypoglycemia and high infant mortality that is associated with these particular alleles.
  • Neither Hardy et al. nor Clemente et al. considered the evidence of compensatory mechanisms paralleling the drop in ketogenesis provided in Greenberg et al.’s paper. Veterinarian Petro Dobromylskyj from the Royal Veterinary College explains it best, saying “there is also evidence that the mutation decreases the inhibitory effect of malonyl-CoA on fatty-acid β-oxidation in mitochondria, thereby partially compensating for the drop in ketogenesis associated with reduced CPT1A activity”.
  • Finally, Greenberg et al. mention their “results of detailed β-oxidation studies in family C showed that oxidation was low at 37°C and were further decreased when measurements were conducted at a higher temperature”. These mutations may well be an adaptation to the freezing temperatures of the environments in which they arose.

[12] “high levels ketones in the blood, which can compromise reproductive function (Kim and Felig 1972)”

[13] “larger infants are born to women with higher blood glucose (Butte 2000), while a link has been made between maternal gestational ketonemia and a reduced off-spring IQ (Rizzo et al. 1991)”

  • Points 12 and 13 can be addressed together. Hardey al. quote a 1972 study by Kim and Felig that studied metabolic responses in pregnant women fasting for 84-90hrs. Specifically, their interests lay in the interplay between amino acids, glucose and insulin. They describe their interest saying “the influence of pregnancy on the changes in plasma glycine, threonine, and serine during fasting are of interest in as much as these amino acids are unique in demonstrating a delayed increase during prolonged starvation of obese nonpregnant subjects”. In fact they recognize the importance and adequacy of gluconeogenesis saying “maternal hepatic gluconeogenic mechanisms are capable of responding to increased substrate [amino acids] delivery during starvation in pregnancy”. Nowhere in their paper are ketones suggested to compromise reproductive function. This study looked at the effects of multi-day fasts – not ketogenic diets – in the context of gestation.
  • In another paper from 1972, Kim and Felig also note that in pregnant mothers, “starvation resulted in significant hypoglycemia and hyperketonemia and in an elevation of free fatty acid and glycerol concentrations. In 13 of 18 fasted subjects, blood glucose levels fell below 50 mg/100 ml. No specific symptoms or signs of hypoglycemia were noted.” Furthermore, the evidence was suggestive “that ketones may become an important fetal fuel during maternal caloric deprivation”.
  • In a 2015 retrospective cohort study of 906 pregnant mothers, Deschamps et al. found that “infants from mothers with a FBG [fasting blood glucose] >95 mg/dL were fatter both in relative (18.7 vs. 14.9%; p<0.05) and absolute (803 vs. 543g; p<0.01) terms. Further, over 50% of infants from mothers with FBG >95 mg/dL had a %fat greater than the 90th %fat percentile”. Increased adiposity may partially account account for the higher birthweight infants of mothers with higher blood glucose levels. This casts a less positive light on Butte’s findings from 2000 than Hardy et al. have.
  • In a 1980 study of calorie-restricted diabetic pregnant mothers, Coetzee et al. found that “neonates born to diabetic mothers with ketonuria had no fetal distress or asphyxia neonatorum [and] positive Ketostix tests in urine samples do not indicate toxic levels in the blood”.
  • It appears that Hardy et al. are confusing the pathological state of diabetic ketoacidosis – a simultaneous and excessive rise in the blood of both glucose and ketones – with simple nutritional ketosis. The latter arises naturally as a result of restricting carbohydrates and moderating protein (or simply fasting).  Hardy et al. quote papers by Nancy Butte and by Rizzo et al. who both looked at gestational diabetes and ketoacidosis, not nutritional ketosis. Rizzo et al. concluded that “the associations between gestational ketonemia in the mother and a lower IQ in the child warrant continued efforts to avoid ketoacidosis and accelerated starvation in all pregnant women”. Butte recommend avoiding ketonemia from her study of gestational diabetes mellitus, not ketogenic dieters. In fact, she recognizes how “the ADA states that the percentage of carbohydrate in the diet is dependent on individual eating habits and that the effect on blood glucose and percentage fat depends on assessment and treatment goals”. She also goes on to emphasize how “the lower percentage of carbohydrate blunts the postprandial hyperglycemia”.

[14] “can also be obtained directly from other dietary sources, or it can be synthesized from other fatty acids such as α-linolenic acid (ALA), which is present in oils from ocean fish, eggs, seed oils, and various leafy plant foods”

  • It is suprising that Hardy et al. do not mention how inefficiently humans convert α-linoleic acid (ALA) into the bioavailable long chain forms, eicosapentaenoic acid (EPA) and docosahexaenoic acid (DHA). In 1998 Gerster H. used radioisotopes to show how adults “with a background diet high in saturated fat conversion to long-chain metabolites is approximately 6% for EPA and 3.8% for DHA. With a diet rich in n-6 PUFA, conversion is reduced by 40 to 50%”. Western diets are excessively rich in omega-6 polyunsaturated fatty acids. Consequently, specifically targeting plant foods as a meaningful source of EPA and DHA is not recommended, especially in light of the 2006 estimate by Simopoulos whereby people eating a Westernized diet have a 15:1 to 16.7:1 ratio of omega-6 to omega-3 (EPA and DHA) fatty acids.

Basophil Activation Test

CD34+ pluripotent progenitor stems cells can give rise to a type of leukocyte termed granulocyte, specifically of the basophil kind. The latter represents less than 1% of peripheral blood leukocytes. It has a characteristically segmented nucleus so that it may maintain the integrity of its genome under an increased load of reactive oxygen species (ROS) originating from its immunological activities. The potential for basophils to be used as markers of inflammation and allergy was first explored in 1991 whilst the technological basis for doing so using flow cytometry preceded it by 26 years. The prominence of basophil activation tests (BAT) has grow in research settings but is only in the introductory phases of clinical settings for the most part as of 2015. In 2011 it was still at the pilot stage as a diagnostic method for allergies to certain venoms and immediate drug hypersensitivity reactions (IDHR). According to the traditional Gell & Coombs hypersensitivity classification system, BAT is quantifying a Type 1 reaction based on the involvement of IgE for releasing histamine. However this is not helpful given that the classification system cannot adequately reflect a continually refined appreciation of the immune system. Understanding the principle underlying BAT first requires comprehending which relevant characteristics of basophils are changing and secondly, how flow cytometry quantifies them. Broadly speaking, the isolation and incubation of cells is the first step of BAT and the second one is the quantification of target cells by flow cytometry.

Figure 1 below depicts the steps by which masts cells release histamine, an immune and inflammatory mediator, in an IgE-FcεRI high-affinity receptor dependent manner. For all intents and purposes the mast cell can be substituted for a basophil in this example.

Mast or basophil IgE-dependent degranulation

Figure 1

IgE antibodies presents the antigen to its IgE-specific FcεRI high-affinity receptor. When enough multivalent antigen cross-linking with adjacent IgE molecules occurs, the cytoplasmic granules fuse with the cell surface membrane and degranulate. This process involves the signal transducing transmembrane tetraspanin CD63 protein coming to the surface of the basophil. This is how it and similar protein CD203c serve as markers of basophil activation. Non-IgE dependent (otherwise named ‘direct’) basophil activation can be triggered by opiates, iodinated radio-contrast dye and antibiotics such vancomycin, β-lactams and quinolones. The mechanism via which this happens is not yet understood. Non-IgE dependent degranulation may partially explain the specificity shortcomings of the assay. Nevertheless, whether activation is mediated by IgE or otherwise, the histamines and other immune mediators released by basophils are involved in early and late-phase allergic reactions.

Inventor M. J. Fulwyler describes his early flow cytometry apparatus in below as essentially, a cell separator, saying “cell volume is measured in a Coulter aperture, and the cells are subsequently isolated in droplets of the medium which are charged according to the sensed volume. The charged droplets then enter an electrostatic field and are deflected into a collection vessel.” Figure 3 is the modern iteration of Fulwyler’s invention with an added laser-based component. Cell size is correlated to how the laser beams reflecting off of them scatters forwards and cell granularity correlates to the side scatter. Different lymphocytes have different granular contents. Separating cells according to their charge can still be used after the laser for further cell sorting.

Early flow cytometer

Figure 2

Modern flow cytometer

Figure 3


Figure 4 shows different populations of cells according to their forward and side scatter characteristics. Basophils are identified in the larger upper central cluster in the figure. The basic principle of how intensely light is reflected and scatters forwards and sideways enables flow cytometry to very precisely identify basophils amongst other molecules present in fluid samples. Furthermore, Subsets of basophils or ‘gates’ are identified using their surface markers like CD123/HLA-DR, CCR3/CD3 and IgE/CD203c.

Figure 4

Figure 4

The experiment use specific monoclonal antibodies complexed to fluorochromes to bind them. Fluorochromes reflect the laser beam which the flow cytometer records for use in subsequent data analysis. Using the same fluorescent signal for cell surface basophil activation receptors CD63 and CD203c, the number of activated basophils within those ‘gated’ subsets can be quantified on a single-cell basis. Figure 5 below depicts how IgE positive (IgE+) basophils are identified. First, Panel A plots the cells’ forward scatter by area and height (FSC-A and FSC-H, respectively). This produces aggregates (or distinct bands) from which basophils can be picked out from. Panel B then plots side scatter height (SSC_H) of the target aggregate against the fluorescent signal reflected by the complexed fluorochromes bound to IgEs. Both the amount of IgE basophils and of IgE on the cell surface is quantified.

Figure 5

Figure 5

Other BAT variations utilize markers of basophil degranulation such as inhibitory receptor Cd300a or “phosphorylation of intracellular signaling molecules such as p38 mitogen-activated protein kinase and signal transducer and activator of transcription (STAT)”. Alternatively, the diamine oxidase enzyme affinity HistaFlow technique can quantify intracellular histamine content. These techniques are not included in this assessment of BAT’s clinical utility. The technique focused on here uses forward and side light scattering as well as fluorochromes for IgE-dependent activation. Food allergen testing will be primarily applied to assessing BAT here.

In 2015, BAT’s in vitro ability to predict the severity of an allergic reaction to a variety of common food allergens was tested against the gold-standard double-blind placebo controlled food challenge (DBPCFC) in 67 patients by Song et al.. Skin prick testing (SPT), secretory IgE (sIgE), total IgE (tIgE), allergen-specific IgG4 (sIgG4) and peanut component-specific IgE (when applicable) were also measured and correlated to BAT. Patients were identified as ‘allergic’ based on an initial 3mm wheal SPT threshold and then administered DBPCFCs consisting of 2 grams of proteins cumulatively dosed from peanut, tree nut, sesame, fish, or shrimp. Positive reactions were graded on a 1 to 5 scale with 5 being the most severe. For BAT, the flow cytometer identified basophils if cells were CCR3+ with a low side scatter and amongst these, activated basophils if they were CD63+. BAT’s 3-dose response curve consisted of 200, 20 and 0.2ng/mL doses of crude peanut, pecan, hazelnut, cashew, sesame, catfish, cod, salmon and shrimp extracts. The negative control was interleukin-3 (IL3). One positive control consisted of an isolated allergen combined with a highly specific monoclonal antibody recognizing the high-affinity binding receptor Fc3RI and the other was the chemotactic peptide N-formyl-methionyl-leucyl-phenylalanine (FMLP). Each allergen has an optimal dose for eliciting maximal basophil activation and determining it is crucial for establishing a robust correlation between the severity of a reaction with a level of basophil activation.

Figure 6 below plots the receiver operating characteristics (ROC) curve of BAT, sIgE and SPT using a binary classification system of ‘sensitivity’ and ‘specificity’. Sensitivity refers to the number of true positives identified as positive and specificity the number of true negatives identified as negative. The BAT results were dose-dependent which is an absolute requirement for starting to validate its use clinically. The highest BAT dose of 200ng/mL produced the greatest area under the curve (AUC) compared to sIgE and SPT, with a value 0.904. This dose was where the most sensitive and specific measures were seen amongst all 3 techniques. The 95% confidence interval for this result is 0.821-0.98 and is statistically significant with a P-value of less than 0.0001. Such a p-value means there is a 99.9999% chance that this result did happen by happenstance.

Figure 6

Figure 6

This is an excellent result for BAT. It adds support to the hypothesis that integrating it into clinical practice will reduce the need for DBPCFCs which are invasive and carry considerable risks. However, important caveats accompany the results. It should be kept in mind that this more traditional CD63 detection method is very specific to the IgE-mediated activation of basophils. This study did not utilize CD203c which “among hematopoietic cells, expression of CD203c is restricted to basophils, mast cells and their precursors, and has been described as specific for this lineage”. Hoffmann et al. have further argued that CD203c could be a more sensitive marker than CD63 for BAT. One on hand, results obtained by Song et al. using the traditional CD63 BAT marker are good because they covers a large segment of reactions in the population. On the other hand, they do not encompass non-IgE basophil activation reactions which are prominent in IHDRs. Despite using the less sensitive activation marker which potentially minimizes the results, this outcome may be partially skewed the other way (that is, positively) because tree nuts and peanuts activate basophils more aggressively than other allergens. It is worth visualizing the correlations in Figure 7 between the BAT dosing curve and DBPCFC scores in order to distinguish the statistical significance of a correlation with the strength of the correlation itself.

Figure 7

Figure 7

Going from left to right, the boxes in Figure 7 are 200, 2 and 0.2ng/mL doses of BAT allergens. For reference, a perfect correlation holds an ‘r’ value of 1. Despite the correlations all being statistically significant, they are quite weak, ranging from 0.32 to 0.5. Looking at the left-most box for example, multiple individuals had a basophil activation rate of 50% yet are found amongst 0 to 5 DBPCFC scorers. Authors Song et al. are more enthusiastic, saying there is in fact a “moderate correlation with clinical reactivity observed in this study [and this] is in line with results from prior studies demonstrating the sensitivity of the BAT”. They bolster this line of thinking by adding that it is a reasonable expectation stemming from the elucidated mechanism discussed above, whereby IgE is involved in basophil degranulation via FcεRIa receptor expression. Ultimately, BAT looks at one kind of allergic response mediated by this non-exclusive mechanism. Luengo and Cardona emphasize the complexity involved in predicting the degrees of allergic reactions by stating how “the risk of developing anaphylaxis depends not only on the allergen sensitization pattern, but also on the avidity and affinity of immunoglobulins to bind the allergen, the route of application, characteristics of the allergen and the presence of cofactors”. In fact, Song et al. pay tribute to this notion when discussing methods for predicting the severity of reactions to peanuts, saying “recent data have suggested that component-resolved diagnostics could be a better predictor of clinical reactivity [to peanuts] and could have some utility in predicting severity of symptoms”. This testifies to the stage of infancy immunology current finds itself in. Which markers best identify acute reactions, allergies or simple exposures are just starting to get teased out. For example, it is only recently that IgG4 has been deemed a better indicator of recent allergen exposure rather one of reaction severity.

BAT’s specific clinical utility regarding peanut allergies is worth exploring via a 2014 controlled study by Santos et al.. 1 primary study population (N=104) was divided into children allergic to peanuts (PA), children sensitive (PS) or not allergic to peanuts at all (NA). An independent population (N=65) was used to assess BAT’s performance in making diagnoses using flow cytometry. The BAT flow cytometry methods for assessing both the primary study population and the independent one were the same. Activated basophils were first identified using the SSClow/CD203c+ and CD123+/HLA-DR gates. Secondly, the activation levels of gated basophils were evaluated as a percentage of CD63+ ones and by the stimulation index of mean fluorescence intensity (MFI) of CD203c+ ones. Finally, the BAT dose curve for peanut allergens was established with a 10-point serial dilution covering 10µg/ml to 0.1ng/mL concentrations. The performance of BAT was assessed against oral food challenges (OFCs) followed by a DBPCFCs and other measures like SPT, peanut-sIgE and Ara h2-sIgE. Ara h2 is not a whole peanut allergen extract (peanut-sIgE) but a particularly allergenic protein in peanuts. The clinical implications the authors extrapolated from their study were that “the basophil activation test to peanut can be performed in cases in which standard allergy tests have failed to diagnose peanut allergy before considering oral food challenges”.

Indeed, within the cut-off values established in the independent study population, BAT’s ROC (green line) was superior to that of the other 3 with a value of 0.97, a sensitivity of 97.6% and specificity of 96.0%. This is represented in Figure 8 below. Panel A shows BAT’s ROC for children with an ambiguous SPT and sIgE history for peanuts and its components. Panel B highlights its ROC according to it performance at the 10 and 100ng/mL concentration points along the 10-point serial dilution.

Figure 8

Figure 8

BAT correctly diagnosed 96.7% of PA children identified via OFCs confirmed with DBPCFCs. Interestingly, BAT achieved the 2 largest clinically useful reductions in the amount of OFCs necessary for identifying PA children. When used as a secondary diagnostic tool following SPT 35 less OFCs are need. When used as a third one following SPT and Ara h2-sIgE 36 less OFCs are need. So far, the authors clinical recommendations appear warranted. However, the BAT assay for PS children cannot detect any significant changes in basophil activation. Furthermore, 11.5% of non-responders were found in the primary study population and 6.2% in the independent (external) one. This means BAT is incapable of identifying between 6 and 11 PAs in a room of 100 people. It is doubtful that BAT can be improved to identify many more PS or non-responders. It is more likely that the test is inherently limited, in the sense that it simply does not cover the entire range of immunological responses capable of inducing a peanut sensitivity or allergy. DBPCFCs remain the gold-standard.

The 2014 paper by Uyttebroek et al. titled “Basophil activation tests: time for a reconsideration” summarizes BAT’s limitations and in so doing carves out the best current and prospective uses for it in clinical settings. There has been wide clinical usage of BAT for IHDR despite ambiguous testing issues regarding the antibiotic fluoroquinolone. The latter has been reported to mediate non-IgE basophil degranulation and when using activation marker CD63, fails in terms of sensitivity and specificity or both when tested across 3 studies in a total of 56 patients. However, when activation marker CD203c is used in only 5 patients in 1 study, there is 100% specificity and sensitivity. Until further study, BAT is in fact potentially confounded by fluoroquinolones. BAT’s sensitivity to NSAIDs – a globally and widely prescribed class of anti-inflammatory agents – is too low for clinical use. However, the authors predict than within 5 years BAT and HistaFlow will receive mainstream implementation for IgE and non-IgE mediated IDHR, respectively – assuming those IDHRs are underpinned by basophil or mast cell (effector cells) degranulation. All considered as of 2014, BAT’s sensitivity and specificity varies between 75% and 95%. Despite its niche use for peanut testing in a second or third diagnosis-reinforcing option, Uyttebroek et al.’s 5 year review of the literature has not uncovered any novel diagnostic applications for BAT in the field of food allergies.

Diabetes

During the upper-middle Neolithic era, about 1500 years B.C, a first description of diabetes as a “too great emptying of the urine” appeared in Egyptian manuscripts. Since then it has suffered from further flimsy nomenclature, attesting to the medical and scientific challenges posed in characterizing its murky & complex etiology. This is somewhat justified by the fact that diabetes carries a disagreeable trio of origins; genetics play a non-trivial role in its incidence (about 10% of cases), it has an autoimmune presentation (Type I Diabetes) and most importantly, lifestyle factors contribute the largest chunk on a population basis (i.e. it is a disease of civilization for the most part). Science however is about making the complex simpler and in the 1960s Peter Cleave did just that by describing diabetes as ”the saccharine disease because he believed sugar and other refined carbohydrates were responsible”. Although scientifically incomplete, it remains a fair and useful heuristic-like description.

If you are diabetic, you will either be a Type I (autoimmune), a Type II or if you also happen to be pregnant you might fit into the (transient) Gestational Diabetes category. A diagnosis is made on the basis of:

  • elevated fasting blood sugars (before at >140mg/dL and currently lower at >125mg/dL)
  • ongoing hyper and/or hypoglycaemic episodes as well as elevated 3 month blood sugar averages (HbA1c ≥ 6.5%, calculated as a % of non-enzymatically glycated hemoglobin). Note that insulin measures are not necessarily part of the diagnosis, one important point which we will get back to.

Most diseases are traditionally viewed as discontinuous qualitative entities but diabetes is not so. The term pre-diabetes implies that the diabetic state is in fact continuous and thus quantifiable. To be considered pre-diabetic one only needs to have fasting blood sugars at or above 100mg/dL.

A

To get a sense of what proportion of a population this can include nowadays, the 2014 age-adjusted World Health Organization (WHO) estimate considers 22.4% of people in Bangladesh to be pre-diabetics. Before the biochemistry of diabetes is explored further, it is helpful to note that most physicians now consider oral glucose tolerance tests (OGTTs) the gold standard for assessing a patient’s location on the diabetic spectrum rather than fasting blood glucose measures. How one handles a 75g liquid bolus of glucose over the following 2 hours holds better predictive power than fasting glucose measures do because this post-prandial mimic better accounts for the interplay of glucose management as a function of insulin dynamics. However this test is also far from perfect. It fails to distinguish between generalized pathological insulin resistance characteristic of diabetes and non-pathological tissue-specific insulin resistance. For example, it can produce false-negatives by failing some individuals on low-carbohydrate or ketogenic diets. This is thought to happen because of non-pathological peripheral insulin resistance which prioritises glucose produced from the liver or coming in from the diet to serve the human brains’ minimal ~40% need for glucose-derived energy; the musculoskeletal system does equally well (if not better) on fatty acids and ketones and can thus become somewhat insulin resistant to manage tissue-specific and whole-body energy homeostasis.

A simple descriptive model of diabetes provides context for grasping its finer intricacies and contentious mechanistic points. When carbohydrates from a meal are absorbed through the intestines they go on to circulate in the blood. They reach various organs like the heart, muscle, liver, brain and non-organ cells like adipocytes. Insulin is (mainly) secreted in response to carbohydrates and performs its fundamental job of getting them (as well as proteins and fats) into cells. Diabetes results when insulin’s action is insufficient for managing the carbohydrate load by getting most of it into various cells and thus out of the blood stream. This results in higher levels of circulating glucose in the blood, namely hyperglycemia. Depending on whether the diabetic is a type I (T1D) or II (T2D), hypoinsulinemia and hyperinsulinemia develop over the long term, respectively.

The resolution of this simplified insulinocentric model can be sharpened in both depth and breadth by integrating 3 more angles. First and most importantly, is to integrate the endocrinological dynamics of insulin with the metabolism of cellular energy management. This should help relate the interplay right down to the flux of energy currency molecules between the cytoplasm and mitochondria as well as those molecules that handle them. Secondly, some thought will be dedicated to insulin’s ‘opposing hormone’ glucagon which will refine the diabetic model, the corollary of which is to render it less insulinocentric. Lastly, the quite mysterious influence of the microbiome upon glucose and whole body energy homeostasis is gaining undeniable scientific prominence due to the alluring correlations it has so far presented. An attempt is made to show how these 3 angles are strongly dependent upon lifestyle factors which includes but is not limited to; nutrition, sleep and movement (or exercise). Each ‘angle’ is differentially understood and does not contribute to the etiology and phenotype of T2D equally. Quantifying each ones apportioning to it is the ball of yarn that has yet to be untangled.

For glucose to get into myocytes, insulin must be present within the blood in sufficient concentrations as to bind its tyrosine kinase insulin receptors (isoform IR-B mainly) that are found within plasma membranes and stick out of the cell surface. Insulin acts as a ligand here. The insulin-binding domain of the receptor is formed by 2 α chains which are the extruding part of the receptor. Its intracellular domain is composed of 2 transmembrane β chains subunits which have carboxyl termini protruding into the cytosol. When the α chains are activated, autophosphorylation of both of the β chain subunits takes place. 2 αβ monomers form upon α chain activation where 3 tyrosine residues on each β chain become phosphorylated by the other β chain. This has for effect of displacing the activation loop 30Å away from the substrate-binding site it was previously occupying, now enabling target proteins to access the site. In turn, insulin-receptor substrate 1 (IRS-1) gets phosphorylated by having a phosphoryl group from adenosine triphosphate (ATP) transferred to the hydroxyl group on its Tyrosine residues (since the initial stimulus comes from insulin in this scenario). Phosphorylated IRS-1 is a nucleation site – somewhat acting akin to a sorting junction – from which protein complexes go on to carry out messages down into the cytosol and nucleus, affecting GLUT4 translocation and gene expression, respectively. GLUT4 translocation happens through a variety of interweaving and still incompletely understood pathways. GLUT4 translocation to the plasma membrane can happen in a phosphatidylinositide 3-kinase (PI3K)-dependent or independent manner. PI3K is a signal transducing enzyme activated by G-protein coupled receptors or tyrosine kinase receptors. Muscle contractions can stimulate GLUT4 translocation in a PI3K-independent manner affecting whole body glucose homeostasis, making it relevant to diabetes and general health. Here however, we consider and continue on from phosphorylated IRS-1 in an insulin stimulated GLUT4 translocation scenario engaging the requisite PI3K. The diagram below depicts phosphorylated IRS-1 forming a complex with PI3K.

Phosphorylated IRS-1 - PI3K complex

PI3K is composed of 2 subunits bound together; regulatory and stabilizing subunit P85 and catalytic subunit p110. p85’s inhibitory activity on p110 is disabled via phosphorylation of its tyrosine residue located on the amino-terminal of its SH2 domain. This activates p110’s catalytic activity and translocates PI3K to the cell membrane where its substrates reside (see ‘Fig.2 The key molecular signals that are turned on and off by insulin regulating GLUT4 traffic’). PI3K phosphorylates it residue phosphatidylinositol-4,5-bisphosphate (PI[4,5]P2), producing phosphatidylinositol-3,4,5-trisphosphate (PI[3,4,5]P3). A key point worth stressing is that the amplitude and time component of the stimuli acting to produce PI(3,4,5)P3 can determine the extent to which and whether or not GLUT4 translocates to the plasma membrane. This point may be an important determinant in the development of insulin resistance since the pulsatility of macronutrient intake (frequency and amplitude) provides important energy availability signals to the cellular milieu in addition to satiety and satiation cues to neuronal circuitry.

Insulin GLUT4 pathway(s)

Returning to the pathway at hand, the phosphorylated PI3K substrate PI(3,4,5)P3 in turn “recruits Akt1/2 [Protein kinase B] to the PM [plasma membrane] and possibly to endomembranes, where the enzyme [Akt1/2] is phosphorylated on the Thr308/309 residue of its activation loop by 3-phosphoinositide-dependent kinase (PDK1)”. It appears Akt2 rather than Akt1 is predominantly involved in this process. Isoforms λ and ζ of atypical Protein Kinase C (aPKC) are only stimulated by insulin and participate in GLUT4 translocation by being recruited to the PDK1/Akt complex, effectively forming a phosphorylated trio. It should be noted that the downstream effectors of PI3K (Akt and aPKC) control GLUT4 translocation both from within intracellular compartments and at the plasma membrane. This is evidenced by the arrow leaving PKC-λ/ζ leading to GLUT4 translocation and by it being complexed to PDKI/Akt visible in ‘Fig.2 The key molecular signals that are turned on and off by insulin regulating GLUT4 traffic’. The IRS-1/PI3K and Akt/aPKC-λ/ζ complexes form by co-purifying (meaning they attract each other) to cellular subfractions enriched in GLUT4 in order to enact its translocation to the plasma membrane. It is still uncertain whether aPKC is necessary for GLUT4 translocation or if Akt alone is sufficient for insulin-stimulated glucose uptake. In any case, a 160kDa protein substrate target of Akt (AS160) acts as a figurative ‘brake’ on insulin-stimulated GLUT4 translocation when its GTPase-activity protein (GAP) domain is in its active form and maintaining its yet unidentified target Rab protein in GDP form. Rab proteins are a branch of the Ras GTPase superfamily of proteins steering intracellular membrane traffic. When 5 of 6 of AS160’s target sites for Akt are phosphorylated, its GAP domain is now inactive. This means its target Rab is phosphorylated and thus changed to GTP form, now rendering it capable of partially inducing GLUT4 translocation from both ERC/TGN (endosomal recycling compartments/trans Golgi network) and SC (specialized compartments) compartments. In vivo data from mice suggest Rab10 is the likely Rab target of AS160. GLUT4 buds off in endomembranes (erroneously termed vesicles), making its way to the plasma membrane where it can catch glucose molecules floating around the cell surface. GLUT4 then mediates the entry of glucose molecules within the cell’s cytoplasm. When insulin levels decrease sufficiently, GLUT4 transporters are removed from the plasma membrane by endocytosis. In so doing, an endomembrane is formed so that the GLUT4 transporter can make its way back inside the cell and fuse with other ones, forming a larger endosome which effectively completes its cycle.

The importance of insulin signaling amplitude and frequency (previously referred to as pulsatility) is reiterated, in so many words, by authors Grant and Donaldson, saying:

“The balance between endocytic uptake and recycling controls the composition of the plasma membrane and contributes to diverse cellular processes including nutrient uptake, cell adhesion and junction formation, cell migration, cytokinesis, cell polarity and signal transduction. Since it is estimated that cells internalize their cell surface equivalent one to five times per hour 1 [my emphasis], endocytic recycling pathways must be robust and coordinately regulated.

At this point it is clear that what and when one eats is front and center in the development and reversal of Type II Diabetes (T2D). The etiology of Type I Diabetes (T1D) however, is immune mediated, so food plays more of a direct role in its management rather than development, as attested to by T1D doctors and athletes. Circadian rhythms compete with food in this hierarchy of factors since they are biological metronomes orchestrating membrane traffic and receptor sensitivity, amongst other tasks. Simply put, food and sleep (1,2) are at the root of prevention, management and reversal of the metabolic syndrome and diabetic phenotype. At last, the discovery of AS160 in the last 10 years provides an exciting new candidate that may possibly lend mechanistic power to another factor in diabetes, namely movement. It presents as a ‘missing link’ or common pathway for both insulin and exercise-stimulated GLUT4 translocation in myocytes capable of affecting whole body glucose homeostasis. This would go some way in explaining the effectiveness of lifestyle interventions over pharmacological ones for diabetes management because the same pathways are exploited from multiple stimuli. Nevertheless, it is important to realize that despite exercise being a tool for improving insulin resistance, it has never been shown that one can ‘out-exercise’ a poor diet or sleep debt.

Getting back to the sequence of molecular events described above, these are specific but not necessarily exclusive to muscle cells. It is but a snapshot of an incredibly more complex overarching process. The point is driven home by Table 11-4 which lists tissue-specific glucose transporters.

Table 11-4 Glucose Transporters

The kind of insulin receptors and isoforms directly affect glucose metabolism and thus diabetes, in addition to also being implicated in certain cancer phenotypes. The genetic and non-genetic (herein referred to as epigenetic or exposomic) influences on insulin are presently innumerable. Insulin resistance characterizes pathological insulin dynamics and may well be the single biggest lever determining human health and disease. This notion is reinforced in Table 15-3, where insulin’s wide influence on genes and pathways is listed.

Table 15-3

Cynthia Kenyon’s work with C. elegans adds support to the importance of insulin and insulin response elements by identifying the influence of orthologous genes daf-2 and daf-16 (IGF-1 and FOXO respectively in humans) which strongly impacting ageing and the development of diabetes, respectively. One pathway via which ageing and diseases manifestation are thought to be influenced is simplified in her mouse-human diagram.

Ageing cynthia kenyon insulin

It delineates a cascade of interactions between growth hormone (GH) and its receptor (GHr), insulin-like growth factor 1 (IGF-1), insulin receptor substrate protein (IRS), Akt and the forkhead family of transcription factors (FOXO). Together they play a role in communicating messages of apoptosis or new growth and repair at the cellular level which not only has obvious implications in cancers but also in diseases of accelerated ageing like diabetes (which will be explored further). Our understanding of how this is mediated is still unclear though. For example, although FOXO is associated with centenarians, the strongest FOXO single nucleotide polymorphism (SNP) association is weak statistically speaking, with an odds ratio (OR) of 1.42 (CI 1.18-1.70), to which the authors caution, saying “…the large confidence intervals for the ORs in both studies imply some uncertainty”. There are stronger longevity measures assessing the impact of diabetes such as the 2010 British report, which estimates that T1D’s live 20 years less and T2D’s 10 years less on average. As evidenced in Table 2, the role of growth hormone and related components of the insulin pathway offer contradictory evidence as it pertains to longevity.

GH & IGF-1 ageing humans

It does however give every indication that the insulin pathway and its components are levers for both and longevity and health.It does however give every indication that the insulin pathway and its components are levers for both and longevity and health. It has yet to be understood how particular actioning of these levers goes on to manifest a diabetic phenotype.

Amino acids and pyruvate, the latter resulting from cytosolic glycolysis (catabolism of glucose), are transported from the cytosol into mitochondria where they feed into the Citric Acid Cycle (TCA cycle). It takes place on the outer mitochondrial membrane where two-thirds of carbon compounds are oxidized in human eukaryotic cells. Fatty acids and ketone bodies circulating in the blood stream are also imported into the mitochondria where they undergo oxidation on the inner mitochondrial membrane along with products from the TCA cycle. These 3 reactions effectively feed into each other, starting with cytosolic glycolysis, leading into the TCA cycle and ending with oxidative phosphorylation. Most of the daily energy derived in humans is derived from fatty acid oxidation. The TCA cycle produces 3 kinds activated carrier molecules NAD+-NADH (oxidized and reduced nicotinamide adenine dinucleotide), FADH2 (reduced flavin adenine dinucleotide) and ribonucleotide GTP (guanosine triphosphate) which all participate in generating ATP that cells and their tissues need at all times for proper function. NADH is also used directly by the cell for energy. Glycolysis and the TCA cycle produce intermediates used in cell building (biosynthesis) in addition to providing raw metabolic energy materials. Of particular interest in diabetes is the balance of  ATP and activated carrier molecule ‘pools’ cells need to continuously maintain, as well as the array of molecules handling these. How diabetic neuropathies manifest can serve to characterize their roles.

Table 2 by Chowdhury et al. lists some of the aberrant mitochondrial physiology found in certain diabetic tissue/culture models.

Table 2 Tissue mitochondrial alterations human rats T2D

In many cases, respiration is compromised from a variety of points. This feature is eerily similar to respiratory deficiencies characteristic of cancer cells. Thiazolidenodione diabetic drugs aim to increase deficient peroxisome proliferator-activated receptor [PPAR] γ co-activator 1α (PGC1-α) activity since PGC1-α stimulates mitochondrial biogenesis. PGC1-α is highly expressed in energy intensive tissues such as skeletal muscle, brain, heart, liver and brown adipose in addition to during energy demanding activities like being cold, exercising and fasting. PGC1-α is a potential molecular link for explaining why, for example, fasting was such a popular intervention for non-insulin dependent diabetics in the pre-insulin era as well as its present day re-implementation.

Elliott P. Joslin explains the clinical significance of fasting and macronutrient restrictions:

“Such individuals [diabetics] should be taught to regulate the quantity of food eaten by the body weight, and never to indulge in unusual quantities of carbohydrate. […] That temporary periods of under-nutrition are helpful in the treatment of diabetes will probably be acknowledged by all after these two years of experience with fasting. In no other way can one so readily keep the urine free from sugar and this is the foundation of all diabetic treatment.”

Chowdhury et al. make the point that “apoptosis-dependent loss of sensory sympathetic neuron perikarya has not [emphasis mine] been found in diabetic humans or animals” but that “mutation or loss of proteins associated with mitochondrial function can lead to neuropathy that mimics that seen in diabetes, for example, loss of function of mitofusin-2 or bcl-w results in a length-dependent sensory fiber degeneration.” As shown in the screenshot of an NIH video presentation, Bcl-w has an anti-apoptotic role, regulating mitochondrial turnover.

Anti & pro-apoptotic genes NIH

Multiple proteins involved in the latter present as strong candidates for pin-pointing molecular disturbances in people with diabetes and metabolic syndromes. It appears that a causal link for mitochondrial dysfunction runs from 5′ adenosine monophosphate-activated protein kinase (AMPK), NAD-dependent deacetylase sirtuins (SIRT1 and 3) and PGC1-α. AMPKinase senses the ATP/ADP ratio and in a state of excess glycolysis that ratio is increased such that enough AMP turns into ADP via substrate-level phosphorylation, causing PGC1-α to downregulate. PGC1-α can no longer prompt adequate mitochondrial biogenesis (as seen in Fig.5).

Axonal degeneration in Diabetic phenoty

Furthermore, cytoplasmic enzyme SIRT1 can sense a hyperglycemia-induced depressed NAD+/NADH ratio. This is often secondary to insulin failing to maintain intracellular glucose homeostasis. This reduces SIRT1’s activity, thereby lowering that of PGC1-α’s, which decreases the rate of mitochondrial biogenesis. The corollary of which is that faulty mitochondria are not adequately repaired or repurposed by autophagosomes. SIRT1 has far reaching impacts on FOXO, PPARγ, PGC1-α and tumor protein 53 (p53).

Fig.4 is edited by Royal Veterinary College trained veterinarian Peter Dobromylskyj and it schematizes the development of insulin resistance in T2D patients by linking faulty mitochondrial action and impaired lipid oxidation.

mitochondria ROS diabetes

For all intents and purposes, the type and manner of fuel use resulting from these molecular cascades resembles the Crabtree effect. In effect, increased glycolysis produces abnormally high levels of ATP through substrate-level phosphorylation which essentially ‘tells’ the cell that TCA cycle oxidative phosphorylation run through the electron transport chain (ETC) is no longer as necessary. Hyperglycemia begets further hyperglycemia. Oxygen consumption is thus reduced. Interestingly, less superoxide (O2) was shown to be associated with T2D in rats. In contrast, more ROSs overall are usually implicated as a hallmark of mitochondrial dysfunction. Which ROSs and the reason for them not being handled by anti-oxidants may provide important clues as to the precise etiological route in one diabetic versus another. This logic may apply to the development of  other metabolic syndromes.

The complex picture interweaving molecular biology and endocrinological mechanisms can easily overshadow the necessity of establishing a sufficiently simple and solid clinical picture for practitioners to guide them in patient care. Thankfully but also tragically, Dr.Joseph Kraft appears to have succeeded in the latter to a great extent, all the while having his findings mostly ignored by the wider medical profession. From 1972 to 1989, Dr.Kraft gathered empirical clinical data on his patients (aged 3 to 91 years old) by performing a glucose tolerance test in conjunction with an insulin assay. Done together, the earliest signs of diabetes and insulin resistance can be identified. This level of diligence and rigor is rare, even by modern standards. During this time period he performed an astonishing 14,383 tests. 95% (2,635) of his patients out of the 2,775 identified as glucose intolerant had T2D, 1.98% (55) had T1D and 2.99% (83) did not have diabetes. 74% (7,102) of his patients out of the 9,598 identified as normally glucose tolerant had T2D hyperinsulinemia, 22% (2,112) did not have diabetes and 4% (384) had pre-hyperglycemic T1D hypoinsulinemia. Dr.Kraft’s several thousand autopsies suggested to him that diabetic pathology is vascular. This observation was also espoused earlier on by Dr.Stout’s from the 1970s onwards due to his experiments strongly implicating the need of insulin action upon the endothelium in order for it to become ‘injured’.

Table 1 lists selective glucagon receptor antagonists that are in phase 1 and 2 clinical trials.

glucagon targets

In large part, the main resurgence of interest in interventions for diabetes targeting glucagon stems from the ugly fact that T1D and far-progressed insulin-dependent T2D is poorly managed by insulin injections. Granted, low carbohydrate-high fat and ketogenic diets greatly reduce the need for insulin injections and broaden this interventions’ margin of error. Nevertheless, this balancing act remains difficult and perilous. The bihormonal (insulin and glucagon) rationale for the management of diabetes is partly based on 6 observations recounted by Robert Unger and Alan Cherrington:

  • insulin deficiency is associated with catabolic events that are partially mediated by glucagon, such as hepatic glucose and ketone production
  • whichever form of poorly controlled diabetes, it is always characterized by hyperglucagonemia
  • leptin and somatostatin are glucagon suppressors and they manage to suppress the catabolic manifestations occurring during insulin deficiency
  • glucagon suppressors leptin and somatostatin suppress all catabolic manifestations of diabetes during total insulin deficiency
  • total destruction of β-cells in -/- glucagon receptor mice does not cause diabetes (a truly inconvenient and reproducible result which the insulinocentric model of diabetes cannot explain)
  • when the pancreas of rats are perfused with anti-insulin serum this engenders severe hyperglucagonemia

In addition to these observations, a known but poorly addressed issue in insulin-dependent diabetes protocols is plasma insulin ‘concentration disparity’. Subcutaneous insulin injections go into adipose and skeletal tissues as well as the liver and pancreatic α and β islet cells. These all require different concentrations of the hormone. This blanket approach “results either in underinsulinization of α cells or in over-insulinization of peripheral tissues [as depicted in panels A, B and C]”.

insulin concentration disparity

These lines of evidence supporting glucagon’s bihormonal importance in the management of diabetes are partially reflected in a 1975 New England Journal of Medicine study of 7 human patients with juvenile-type diabetes (T1D). It would most likely be impossible to replicate nowadays. It showed that these patients did not develop diabetic ketoacidosis for 18 hours after acute withdrawal off of insulin as long as glucagon was suppressed from pancreatic α cells using somatostatin-14. The latter form of somatostatin has higher affinity with pancreatic α cell receptors while somatostatin-28, which is released upon intake of dietary fat, has higher affinity with pancreatic β cell receptors. When β cells are non-functional, as was essentially the case in this study, a high-fat diet will partially suppress glucagon, albeit in a relatively weak manner due to somatostatin-28 release acting on α cells.

The authors schematize the mechanism in Figure 6 whereby insulin’s action is secondary in importance to that of glucagon’s and they describe the implication of their result, explaining how “insulin per se does not lead to diabetic ketoacidosis in man and that glucagon, by means of if its gluconeogenic, ketogenic, and lipolytic actions, is a prerequisite to development of this condition.

Bihormonal diabetic ketoacidosis

Beyond the hormones insulin and glucagon, the human microbiome presents itself as potentially novel player of note impinging upon whole body glucose and energy homeostasis. The last 10 years have heralded the emergence and importance of the human microbiome which now also adds an astounding layer of complexity to diabetes. A 2012 study by Vrieze et al. showed that within 6 weeks of a fecal microbiota transplantation (FMT) from lean donors to obese recipients with metabolic syndrome, the obese recipients displayed improved insulin sensitivity as measured by “a median rate of glucose disappearance […] from 26.2 to 45.3µmol/kg/min; P < 0.05”. The mechanisms mediating this are uncertain. The statistically significant (P < 0.05) changes in butyrate-producing bacterial species in the proximal and distal intestines suggest to the authors “that butyrate produced by certain bacteria prevents translocation of endotoxic compounds derived from the gut microbiota which has been shown to drive insulin resistance”.

The diagram of Udayappan et al. depicts 2 ways in which “altered [i.e. less Short Chain Fatty Acid-producing] gut microbiota composition may affect the host metabolism via impaired intestinal barrier function resulting in low-grade endotoxaemia”.

SCFAs endotoxemia

It is important to note that the statistically significant changes in bacterial populations in the Vrieze et al.-FMT study should not be assumed to biologically significant long-term – not until further replication and supporting data is seen. Nevertheless, the changes in glucose metabolism seen after FMT interventions are striking and so far do not suggest they would bring with them the brutal and numerous side affects of popular glucose lowering agents.

There is an irony whereby conventional medicine both espouses insulinocentrism in many respects yet concomitantly fails to appreciate its veritable actions and wider relevance. The insulinocentric models of diabetes does need broadening and refining. The bihormonal approach to diabetes sharpens the classic endocrinological picture. Renewed appreciation for the powerful effects of food, sleep and exercise (otherwise known as lifestyle factors) capable of altering the diabetic phenotype revives effective late 19th and early 20th century interventions. The microbiome is posed to help fill-in knowledge gaps about diabetes and metabolic syndromes by characterizing the nature of the relationship between our organism and microbiome. It can be concluded that the preponderance of evidence points to insulin as being the biggest single lever in the etiology and reversal of diabetes. However, insulin can be acted upon by many inputs, reflecting its central endocrinological and metabolic role in regulating whole-body energy homeostasis. There is more than mere hope for culling the impact of diabetes worldwide.

Defining terms for Type 2 Diabetes

In the midst of studying Chronic Multifactorial Diseases the distinction between those caused by 1 mutation (monogenic) or multiple ones (polygenic) came up. I was asked by my teacher

to find more examples to fit the following: A polygenic disorder or a disorder that is thought to have an underlying genetic cause (or a range of underlying genetic causes)

Defining terms is important & it can be annoying to have those terms redefined.

So, I answered:

Using the term ‘genetic causes’ when discussing polygenic diseases is problematic for 2 reasons. First, to many researchers and most laymen, it implies that it is only a matter of time before these genes enact diseased phenotypes, as if on a count-down. Second and more importantly, it assumes there is a direct causal path between the emergence of phenotype from genotype. These ‘genetic causes’ are usually derived from GWAS (Genome Wide Association Studies) which make statistical claims based on associations of phenotypes and specific mutations – not biochemical, causal arguments. With these points in mind and in contrast to them, the term ‘genetic predispositions’ is much less problematic. It recognizes statistical associations between genes/mutations and phenotypes, whereby having certain genotypes makes it more or less likely to see a certain phenotype emerge but ignores causal arguments (since it cannot make them).

Type II Diabetes Mellitus (T2D) is a disease of insulin resistance causing glycemic control issues. It is considered a chronic and progressive lifestyle disease by the Australian Diabetes Association and the American Diabetes Association. Its aetiology stems in large part from modern lifestyle factors,  chief amongst which nutritional ones. However, it is incorrect to call it a chronic and progressive disease. It is considered as such because most diabetics manage their disease by covering their dietary carbohydrate load with exogenous insulin. In this scenario, it does become chronic and progressive. For in depth discussions of why this is the case with the accompanying references and clinical case reports, please watch video presentations by Dr. Jason Fung. Currently, the best treatment for slowing, halting or reversing T2D involves a nutritional intervention which lowers ones total (and especially refined) dietary carbohydrate load to reduce insulin resistance and thus achieve better glycemic management. Assuming an isocaloric macronutrient shift, this automatically entails increasing the total fat load. A focus on lifestyle interventions is all the more logical considering 36 genes identified as predisposing people to diabetes can explain 10% of why people get it. Additional lifestyle factors relevant to T2D are near innumerable, although chief amongst them are sleep and exercise.

My course still uses saturated fat as an example of lifestyle factors negatively affecting CVD/CAD. It’s a sad state of affairs and testifies to how slow and conservative the medical profession is when it comes to updating guidelines.