
Abstract
The evolutionary selective pressures which drove human encephalization are passionately debated, largely because the brain’s function accounts for much of our ill-defined and ever-changing ‘human uniqueness’. Apportioning individual contributions from the multitude of factors ranging from climate change to food and socialization dynamics requires a truly multidisplinary approach encompassing evolutionary biology, genetics, medicine, archeology, chemistry, physics, climatology and many more scientific fields. It is with this wider perspective that evidence for how food contributed to human encephalization is assessed. Clues from human metabolism, anatomy and food web positioning in addition to stable isotope analyses do not generally support the hypothesis that cooked starches were a major driver of human encephalization. Land and marine life as wells as birds and insects seem to have contributed substantially more to it. 11 points on metabolism, 1 on genetics, 1 on paleoanthropology and 1 on stable isotope analyses are individually rebutted.
In their paper, The importance of dietary carbohydrate in human evolution, Hardy, Brand-Miller, Brown, Thomas and Copeland argue for the importance of dietary carbohydrate (mainly in the form of cooked starches) in human evolution and particularly encephalization. One way they do this is by drawing an association between the supposed advent of controlled fire use (cooking) by hominims with increases in AMY1 copy numbers. Neither the timeline for the emergence of cooking or the AMY1 copy number increase are supported by their citations or by more recent evidence discrediting this purported association. Much of their argument is thus based on genetics, paleoanthropology and both general and specific claims of human metabolism as well as stable isotope anlayses, all of which can be individually rebutted.
Stable istope analysis
Hardy et al. severely misquote a 2009 paper by Richards and Trinkauss – in which stable isotope analyses of Oase 1 humans and Neanderthals were performed – because it is used to support the notion that human diets likely included substantial amounts of starch given the variations in δ15N and δ13C ratios.
[1]“a wider range of isotopic values have been observed in contemporary Middle Pleistocene H. sapiens (Richards and Trinkaus 2009), indicating that considerable differences in the levels of starch consumption existed between these two species”
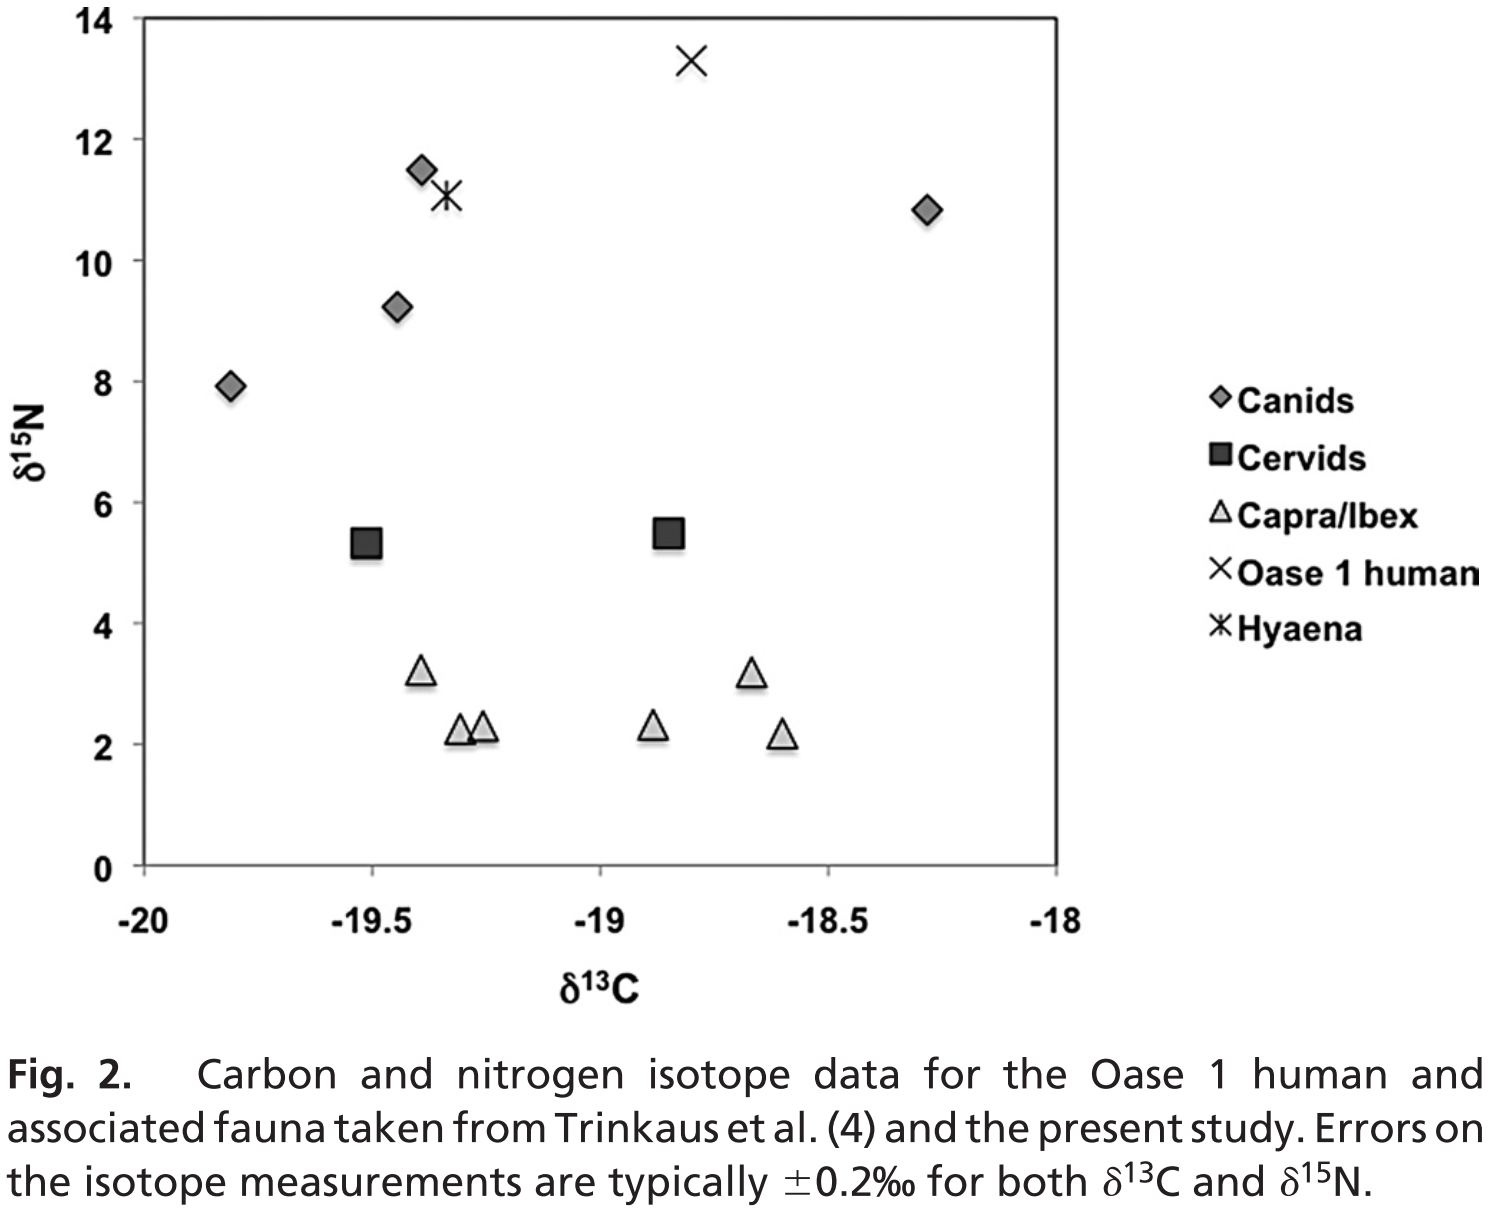
The 2009 paper by Richards & Trinkauss actually found that “early modern humans (~40,000 to ~27,000 cal BP) exhibited a wider range of isotopic values, and a number of individuals had evidence for the consumption of aquatic (marine and freshwater) resources […] The other early modern humans all have δ13C values < –18.5‰ (see Fig. 1 and Table S2), which indicate that their protein came from terrestrial C3 (or freshwater) foods, yet many of them have high δ15N values, at or above the highest Neanderthal values”. It is unequivocal that the δ15N and δ13C variations refer to the dietary apportioning of land versus marine protein, not to the ratio of dietary carbohydrate versus fat. In fact, the authors clearly state that “The Oase I δ15N value is also above those of the hyena (11.1‰), and the highest wolf value (11.5‰) from the same site and dating to about the same time”. This also unequivocally contradicts the notion that starches were a significant dietary contributor for these hominins given that this evidence suggests that they were more carnivorous than Neanderthals, hyenas and wolves as evidenced by their Figure 2 represented here.
Genetics
Hardy et al. cite 2 papers to substantiate the claim that the copy number increase of AMY1 occured less than 1 million years ago despite neither paper supporting it.
[2]“it [multiplication of the AMY1 genes] is thought to be less than 1 million years ago (Samuelson et al. 1996; Lazaridis et al. 2014)”
- The first paper from 1996 by Samuelson et al. gives no specific date concerning the emergence of AMY1 copy number increase since it was not the objective; their objective was to “infer the structures of common ancestors and trace the evolution of the modem human amylase promoters”. The second is a 2014 paper by Lazaridis et al. which also does not mention a date for AMY1 copy number increase since it is focused on issues of lineage by studying 7-8kya Neolithic skeletons from La Braña (Spain), Motala (Sweden) & Loschbour (Germany). Only once does Lazaradis et al. briefly reference a hypothesized association between AMY1 copy number increase and high starch diets by citing Perry et al. 2007. Interestingly, the latter reference contradicts Hardy et al.’s purported timeline for AMY1 gene copies increase as, in their words, it was mosty likely of “a relatively recent origin that may be within the timeframe of modern human origins (i.e., within the last ∼200,000 years”.
- Irrespective of when the when copy numbers of AMY1 increased, the significance of this is still unclear. It has been hypothesized that more copies of the AMY genes would improve glucose homeostasis on higher starch diets and protect against obesity (1, 2, 3). Nevertheless, Nature Genetics in June 2015 published a study by Usher et al. where the authors did “not observe even a nominal association between obesity and the copy number of any amylase gene (P = 0.70 for AMY1)” nor did they in diabetic cohorts where “AMY1 copy number did not associate with BMI in any group (P = 0.31 for GoT2D controls, P = 0.24 for GoT2D cases and P = 0.53 for InCHIANTI samples)”. Usher et al. explain why previous studies may have found associations that were not there given the use of ”lower-precision molecular methods, such as RT-PCR and array comparative genomic hybridization (CGH), or lower-precision analyses of whole-genome sequencing data to measure copy number”. It would be prudent to first understand the significance of the AMY genes in humans before using them as a mechanistic foundation in arguments relating to the evolution of humans and their encephalization.
- In June 2015 Perry et al. avoided using “lower-precision molecular methods […] to measure copy number”, unlike Carpenter et al.’s group in March of that same year. This improved copy number assessment enabled Perry et al. to confidently conclude that “AMY1 gene duplications are likely human-specific and that they occurred following the divergence of our lineage from the Neandertal/Denisovan lineage ~550-590 kya”, contradicting Hardy et al.’s less than 1 million years ago timeline.
Paleoanthropology
Hardy et al. correctly cite the only paper to date supporting their view of hominim cooking emerging less than 800kya. However, the natural event confounding the interpretation provided by this paper and more recent evidence to the contrary are not mentioned as a counterbalance. Furthermore, Hardy et al. do not provide the reader with a representative view of the balance of evidence which currently is heavily biased towards the hypothesis of fire emerging 400-300kya.
[3]”Gesher Benot Ya’aqov, in Israel, which dates to around 780,000 bp, has charcoal, plant remains, and burned microartifacts in concentrations that the excavators believe suggests evidence for hearths (Alperson-Afil 2008)”
- A 2008 paper by Alperson-Afil is cited as evidence of when hominin cooking emerged 780kya as evidenced by the Gesher Benot Ya’aqov (GBY) site in Israel. It does in fact conclude that “as the scenario of a natural fire is unlikely, we conclude that the concentrations of burned flint microartifacts in the different occupational surfaces of GBY represent phantom hearths, i.e. remnants of hominins’ use of fire”.
- This conclusion is probelmatic for 2 major reasons. The first is addressed by Shimelmitz et al. in 2014, where it is explained that “consistent evidence for fire is found not just in the Tabun sequence but at every Acheulo-Yabrudian cave site where good information is available. The near-absence of burnt flints in the lower 8m of the sequence at Tabun (composed of 19 layers) also indicates that the scarcity of fire evidence before 350 kya is not just a matter of spotty preservation, or cave sites versus open air-sites (e.g., Gowlett and Wrangham, 2013). Rather, the negative evidence from the early layers is genuine, and there is a significant and permanent increase in the frequency of evidence for burning between 357 and 324 kya […] our best estimate for the onset of regular fire use at Tabun is between 357 and 324 kya”.
- The second problem is that lava probably invaded the GBY site, as correlated with the Matuyama-Brunhes chron boundary event taking place 781kya. This occurence further substantially confounds Alperson-Afil’s interpretation. Evidence for this event at GBY stems from “artefacts in fluvial conglomerates, organic-rich calcareous muds and coquinas that accumulated along the shorelines of the palaeo-Hula lake (Goren-Ibar et al. 2000)”.
Metabolism
A lot of Hardy et al.’s argument for the important role of dietary carbohydrate in human evolution and the spectacular encephalization is based upon claims about metabolism. These 11 points are at best taken out of context or at worse entirely false.
[4]“There is debate on whether dietary carbohydrates are actually essential for human nutrition”
- Micronutrients and macronutrients have been defined as essential when their absence causes a deficiency syndrome. No such ‘carbohydrate deficiency’ has been found to date and, to the best of my knowledge, nor has any suggestive evidence surfaced in the last century.
- The 1999 report by the IDECG Working Group, led by DM Bier, recognizes that “the theoretical minimal level of carbohydrate (CHO) intake is zero”, before following on about its importance in human biological function.
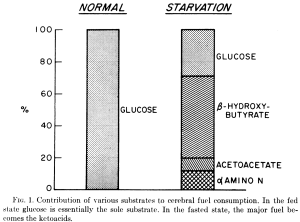
- Glucose is essential for cells to function but it does not have to originate from dietary sources due to an evolved gluconeogenetic capacity capable of providing 150 grams per day for CNS functions. This lack of reliance on dietary glycose has been validated since at least 1975 by Cahill and Owen’s 2 month starvation experiment. Depicted in their Figure 1, they found that the human brain always requires at least 35% of its energy from glucose (not necessarily of dietary origin).
- In 1972 Drenick et al. stress-tested human reliance on endogenous glucose showing that “after fasting 2 months, administration of weight-adjusted doses of insulin […] no insulin reactions nor significant rises in catecholamine excretion occurred despite equal extent and rate of glucose fall. Glucose concentrations as low as 0.5 mmoles/liter (9 mg/100 ml) failed to precipitate hypoglycemic reactions.”
- When dietary carbohydrates are avoided entirely and protein is moderated the human brain will use ketone bodies as its primary energy substrate. In such a metabolic state, Vanitalie and Nufert say that “although these data need confirmation, they suggest an increase in the metabolic efficiency in human brains using ketoacids as their principal energy source in place of glucose”.

[5]“a more realistic recommendation is that at least one-third of dietary energy should be supplied from carbohydrates (Bier et al. 1999)”
- For this Hardy et al. quote, the 1999 report by the IDECG Working Group, led by DM Bier, does not identify a carbohydrate deficiency syndrome but advises at least 150g per day for “practical reasons”.
- Dr.Eric Westman summarizes his findings about carbohydrates being non-essential saying “although there is certainly no evidence from which to conclude that extreme restriction of dietary carbohydrate is harmless, I was surprised to find that there is similarly little evidence to conclude that extreme restriction of carbohydrate is harmful.”
[6]“Glucose is the only energy source for sustaining running speeds above 70% of maximal oxygen consumption (Romijn et al. 1993)”
- Brook et al., who developed the Cross-Over Point hypothesis, did not state that glucose was the only energy source above 70% VO2 max, only that it and glycogen were the main sources and free fatty acids the minor source. Hardy et al. essentially describe a binary change in energy substrate use when in fact the change is quantitative.
- It is an unproven assumption that carbohydrates of dietary origin are necessary to use glycogen and glucose as the predominant substrate for instances of near maximal VO2. Even if it were true that glucose use always predominates across all individuals at >70% VO2 max, this does not automatically imply that dietary glucose is the necessary fuelling strategy for sustaining such intense efforts. These are separate claims.
- In 2015 Hetlelid et al. showed that well-trained runners performing high intensity training at 85% VO2 max, nearly one third of the total energy expenditure comes from fat oxidation. Furthermore, the lower intensity, steady state equations of indirect calorimetry used here and elsewhere overestimate carbohydrate oxidation and underestimate fat oxidation.
- In 2014 Noakes, Volek and Phinney characterize this quantitative change in energy substrates according to effort intensity, saying “some highly adapted runners consuming less than 10% of energy from carbohydrate are able to oxidise fat at greater than 1.5 g/min during progressive intensity exercise and consistently sustain rates of fat oxidation exceeding 1.2 g/min during exercise at ∼65% VO2max, thereby providing 56 kJ/min during prolonged exercise. The remaining energy would comfortably be covered by the oxidation of blood lactate, ketone bodies and glucose derived from gluconeogenesis”
- Preliminary results from Volek et al.’s soon to be published FASTER study (Fat Adaptated Substrate Oxidation in Trained Elite Runners) have been reported at www.ultrarunning.com. Maximal fat oxidation rates higher above 1.54g per minute with 1 subject reaching 1.8g were shown. Classic sports physiology literature performed in non-ketogenic dieters with sub-optimal fatty acid oxidation capacities previously found maximal fat oxidation rates of only 1g min. These findings will, quite literally, require re-writing text books.
- Elite ultra-runner and FASTER study participant Zach Bitter shared his personal data. At 75% VO2 max he used 98% fat and 2% carbohydrate. At 84% VO2 max he used 76% fat and 24% carbohydrate. Finally, at 96% VO2 max he was still using 23% fat and 77% carbohydrate.
[7]“In an evolutionary context, large stores of glycogen must be generated in order to provide sources of glucose for periods of sustained fasting or hardship. To build these reserves, the diet must consistently provide energy surplus to basal metabolic requirements”
- The human gluconeogenetic capacity mentioned above disqualifies this imperative statement. Red blood cells, immune cells and the brain, as well as the more extended CNS, all function properly with glucose solely of endogenous origin.
- The average lean male has tens of thousands of stored calories available to him in adipose tissue in contrast to his glycogen storage capacity of approximately 15 g/kg. Furthermore, his adipose tissue contains all the glycerol precursors required for endogenous production of glucose when combined with amino acids.
[8]“The diets of traditional Arctic populations are sometimes given as examples of successful high-protein diets (Lindeberg 2009)”
- It is a common mistake to assume that the Inuit ate high-protein diets or it may simply be a misnomer arising from its association with the consumption of animal protein. In humans, high-protein diets lead to protein poisoning, otherwise known as ‘rabbit starvation’ (4, 5). The protein ceiling is 35-40% of calories or 200-300g of protein a day. The Inuit ate high-fat diets and their protein intake was moderate. Unlike the livers and kidneys of lions or wolves, human livers have substantially lower functional hepatic nitrogen clearances (FHNC) and urea nitrogen synthesis rates (UNSR) (6, 7).
[9]“15–20% from carbohydrate principally in the form of glycogen from the meat they consume (Ho et al. 1972)”
[10] “Meat frozen soon after slaughter will retain much of its muscle glycogen (Varmin and Sutherland 1995)”
- Points 9 and 10 can be addressed together. The citation for point 7 should be “Varnam and Sutherland 1995”.
- Greenberg et al. recognize the Inuit diet as one of “80–85% fat, 15–20% protein, and, apart from a little muscle glycogen, almost no carbohydrate” by citing Phinney’s 2004 paper.
- Ho et al.’s 1972 study conduced in Point hope, Alaska, does not provide evidence of how this estimate is arrived except that it is based off of a 3,000-4,500kcal diet. Presumably, the reported glycogen levels are those of live animals.
- Raw meat from a dead seal contains 0 grams of carbohydrate. In fact, in 1995 Varnam and Sutherland themselves explain that “if meat is frozen before ATP and glycogen levels are depleted post-mortem glycolysis is suspended. On thawing, however, the meat undergoes severe contraction with associated toughening and loss of large quantities of drip (thaw rigor)”. Simply stated “in response glycogen, the main energy store in the muscle, is converted to lactic acid by anaerobic, post-mortem glycolysis”. Momentarily and drastically slowing post-mortem glycolysis by flash-freezing meat will not stop glycolysis from depleting glycogen when the meat is finally thawed for consumption. The resulting lacate is a glucose element but is not counted into the percentage of dietary carbohydrate in a diet.
- Flash-frozen meat does not contain glycogen levels anywhere near those necessary to support Hardey et al.’s statement. In 1976 Hamm explains how “the regulatory enzymes which control ATP metabolism and glycolysis in the living tissue are still active in the muscle postmortem, but these enzymic mechanisms are not able to maintain the ante-mortem levels of ATP and glycogen because the oxygen supply of the cell is stopped as soon as the blood circulation is interrupted by death of the animal. The lack of the aerobic ATP synthesis from ADP in the muscle mitochondria results in an anaerobic depletion of glycogen and consequently in a disappearance of ATP within a few hours p.m.”
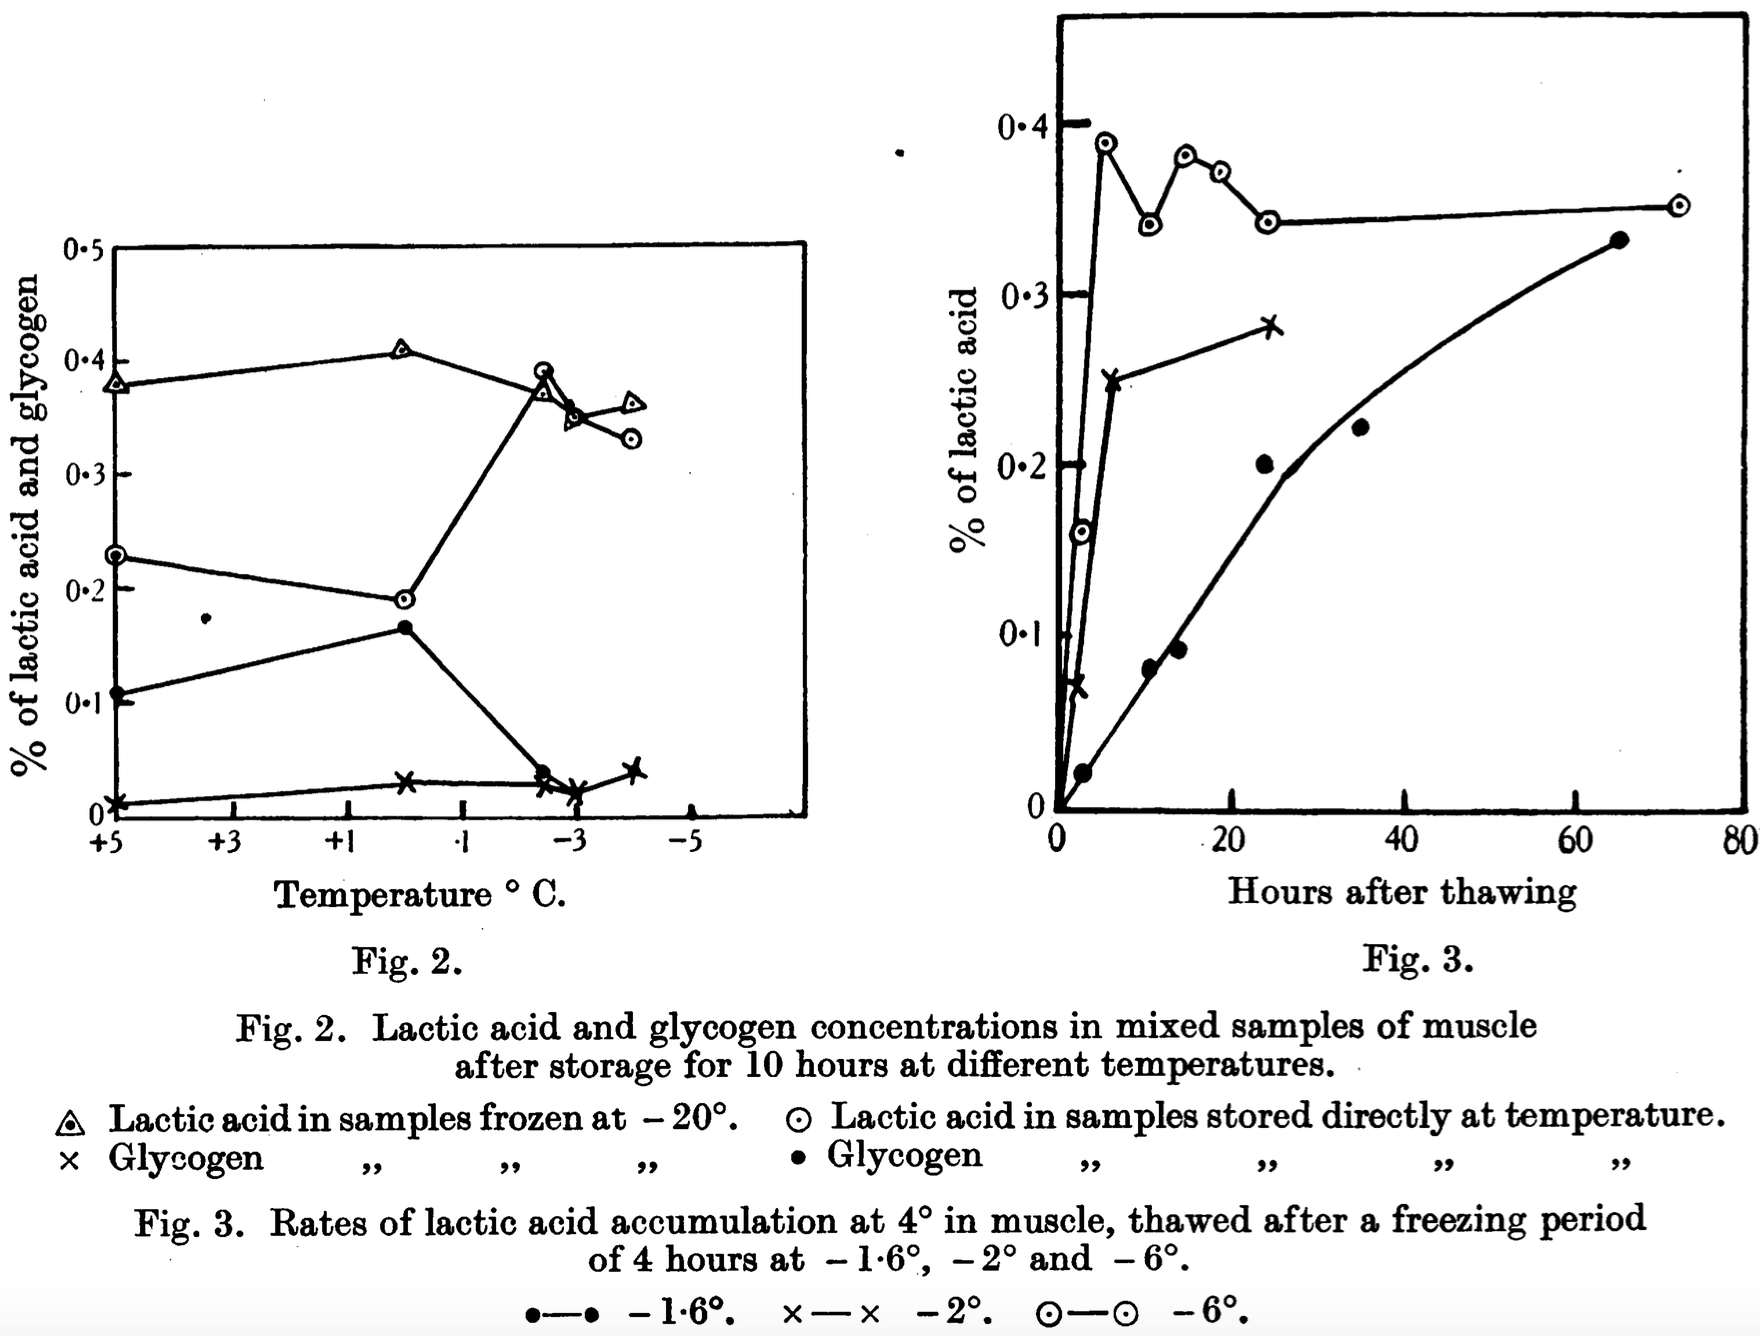
- In 1936 Sharp related glycogen’s conversion to lactic acid over time as a function of temperature (°C) saying that “in fish-muscle in the frozen state the maximum rate of glycogenolysis occurs in the interval -3.2° to -3.7 [and] freezing at -2° and lower temperatures for a period of 4 hours causes injury to the muscle, resulting in very rapid lactic acid formation on thawing. Freezing at 1.6° has no such effect, and on thawing the normal rate of lactic acid formation is resumed.” Figure 2 and 3 from his paper graphically illustrate this relationship.

[11]“the derived A-allele [CPT1A gene] has been shown to associate associate with hypoketotic hypoglycemia and high infant mortality […] suggests that it is an important adaptation to high meat, low- carbohydrate diets”
- The association between hypoketotic hypoglycemia and high infant mortality with the CPT1A allele is from Clemente et al.’s 2014 paper which references a 2009 paper by Greenberg et al. entitled “The paradox of the carnitine palmitoyltransferase type Ia P479L variant in Canadian Aboriginal populations” in which 3 familes for a total of 7 patients were studied. The conclusion was that “severe clinical effects have been observed in only some, but not all, infants and young children [and] the occurrence of hypoglycemia, the main initial clinical effect of CPT-I deficiency, is dependent upon many environmental factors, including infection, feeding history and long-chain fat content of the diet, glycogen stores in the liver, and perhaps even climate“.
- Clemente et al. found “strong evidence in favor of selection from a de novo mutation P(SDN) = 0.98, as opposed to selection on standing variation”. In simple terms, this means it was strongly positively selected for in high latitude populations eating very high-fat diets. Clemente et al. characterize these CPT1A mutations as “strong deviations from mutation-drift equilibrium”. Interestingly, Greenberg et al. describe the CPT1A mutations as ‘a paradox’ whilst Clemente et al. as ‘deleterious’. Patient 2 in the study of the former, for example, was most likely on a Westernized, relatively high carbohydrate diet described as a “regular diet and skim milk”. Such a diet underpins many ‘diseases of civilization’ and most likely contributed to the hypoketotic hypoglycemia and high infant mortality that is associated with these particular alleles.
- Neither Hardy et al. nor Clemente et al. considered the evidence of compensatory mechanisms paralleling the drop in ketogenesis provided in Greenberg et al.’s paper. Veterinarian Petro Dobromylskyj from the Royal Veterinary College explains it best, saying “there is also evidence that the mutation decreases the inhibitory effect of malonyl-CoA on fatty-acid β-oxidation in mitochondria, thereby partially compensating for the drop in ketogenesis associated with reduced CPT1A activity”.
- Finally, Greenberg et al. mention their “results of detailed β-oxidation studies in family C showed that oxidation was low at 37°C and were further decreased when measurements were conducted at a higher temperature”. These mutations may well be an adaptation to the freezing temperatures of the environments in which they arose.
[12] “high levels ketones in the blood, which can compromise reproductive function (Kim and Felig 1972)”
[13] “larger infants are born to women with higher blood glucose (Butte 2000), while a link has been made between maternal gestational ketonemia and a reduced off-spring IQ (Rizzo et al. 1991)”
- Points 12 and 13 can be addressed together. Hardey al. quote a 1972 study by Kim and Felig that studied metabolic responses in pregnant women fasting for 84-90hrs. Specifically, their interests lay in the interplay between amino acids, glucose and insulin. They describe their interest saying “the influence of pregnancy on the changes in plasma glycine, threonine, and serine during fasting are of interest in as much as these amino acids are unique in demonstrating a delayed increase during prolonged starvation of obese nonpregnant subjects”. In fact they recognize the importance and adequacy of gluconeogenesis saying “maternal hepatic gluconeogenic mechanisms are capable of responding to increased substrate [amino acids] delivery during starvation in pregnancy”. Nowhere in their paper are ketones suggested to compromise reproductive function. This study looked at the effects of multi-day fasts – not ketogenic diets – in the context of gestation.
- In another paper from 1972, Kim and Felig also note that in pregnant mothers, “starvation resulted in significant hypoglycemia and hyperketonemia and in an elevation of free fatty acid and glycerol concentrations. In 13 of 18 fasted subjects, blood glucose levels fell below 50 mg/100 ml. No specific symptoms or signs of hypoglycemia were noted.” Furthermore, the evidence was suggestive “that ketones may become an important fetal fuel during maternal caloric deprivation”.
- In a 2015 retrospective cohort study of 906 pregnant mothers, Deschamps et al. found that “infants from mothers with a FBG [fasting blood glucose] >95 mg/dL were fatter both in relative (18.7 vs. 14.9%; p<0.05) and absolute (803 vs. 543g; p<0.01) terms. Further, over 50% of infants from mothers with FBG >95 mg/dL had a %fat greater than the 90th %fat percentile”. Increased adiposity may partially account account for the higher birthweight infants of mothers with higher blood glucose levels. This casts a less positive light on Butte’s findings from 2000 than Hardy et al. have.
- In a 1980 study of calorie-restricted diabetic pregnant mothers, Coetzee et al. found that “neonates born to diabetic mothers with ketonuria had no fetal distress or asphyxia neonatorum [and] positive Ketostix tests in urine samples do not indicate toxic levels in the blood”.
- It appears that Hardy et al. are confusing the pathological state of diabetic ketoacidosis – a simultaneous and excessive rise in the blood of both glucose and ketones – with simple nutritional ketosis. The latter arises naturally as a result of restricting carbohydrates and moderating protein (or simply fasting). Hardy et al. quote papers by Nancy Butte and by Rizzo et al. who both looked at gestational diabetes and ketoacidosis, not nutritional ketosis. Rizzo et al. concluded that “the associations between gestational ketonemia in the mother and a lower IQ in the child warrant continued efforts to avoid ketoacidosis and accelerated starvation in all pregnant women”. Butte recommend avoiding ketonemia from her study of gestational diabetes mellitus, not ketogenic dieters. In fact, she recognizes how “the ADA states that the percentage of carbohydrate in the diet is dependent on individual eating habits and that the effect on blood glucose and percentage fat depends on assessment and treatment goals”. She also goes on to emphasize how “the lower percentage of carbohydrate blunts the postprandial hyperglycemia”.
[14] “can also be obtained directly from other dietary sources, or it can be synthesized from other fatty acids such as α-linolenic acid (ALA), which is present in oils from ocean fish, eggs, seed oils, and various leafy plant foods”
- It is suprising that Hardy et al. do not mention how inefficiently humans convert α-linoleic acid (ALA) into the bioavailable long chain forms, eicosapentaenoic acid (EPA) and docosahexaenoic acid (DHA). In 1998 Gerster H. used radioisotopes to show how adults “with a background diet high in saturated fat conversion to long-chain metabolites is approximately 6% for EPA and 3.8% for DHA. With a diet rich in n-6 PUFA, conversion is reduced by 40 to 50%”. Western diets are excessively rich in omega-6 polyunsaturated fatty acids. Consequently, specifically targeting plant foods as a meaningful source of EPA and DHA is not recommended, especially in light of the 2006 estimate by Simopoulos whereby people eating a Westernized diet have a 15:1 to 16.7:1 ratio of omega-6 to omega-3 (EPA and DHA) fatty acids.

Post-Exercise Muscle Glycogen Repletion in the Extreme: Effect of Food Absence and Active Recovery
Click to access v3n3-4pdf.pdf
Good review paper, of interest highest intensity exercise produced lactate mostly recycled back to glycogen resulting in little nitrogen loss. Prolonged moderate intensity exercise not great in fasting due to oxidation of lactate.
LikeLiked by 2 people
Thanks! Yes it really makes you question the validity of a “carb back-loading” rationale & even if it is correct, how much of an effect does it actually have?
It seems clear that having a good fight or flight response capacity is essential to survival, so having to rely so strongly on dietary carbohydrates multiple times per day to maintain it seems far from an optimal strategy for the apex predators that we are…at the very least, the burden of proof lies squarely on those who propose such a hypothesis whereby we humans rely on dietary carbohydrate to that extent.
LikeLiked by 2 people